Wind Power Density Estimation In The Middle of Iraq “Karbala Site”
advertisement
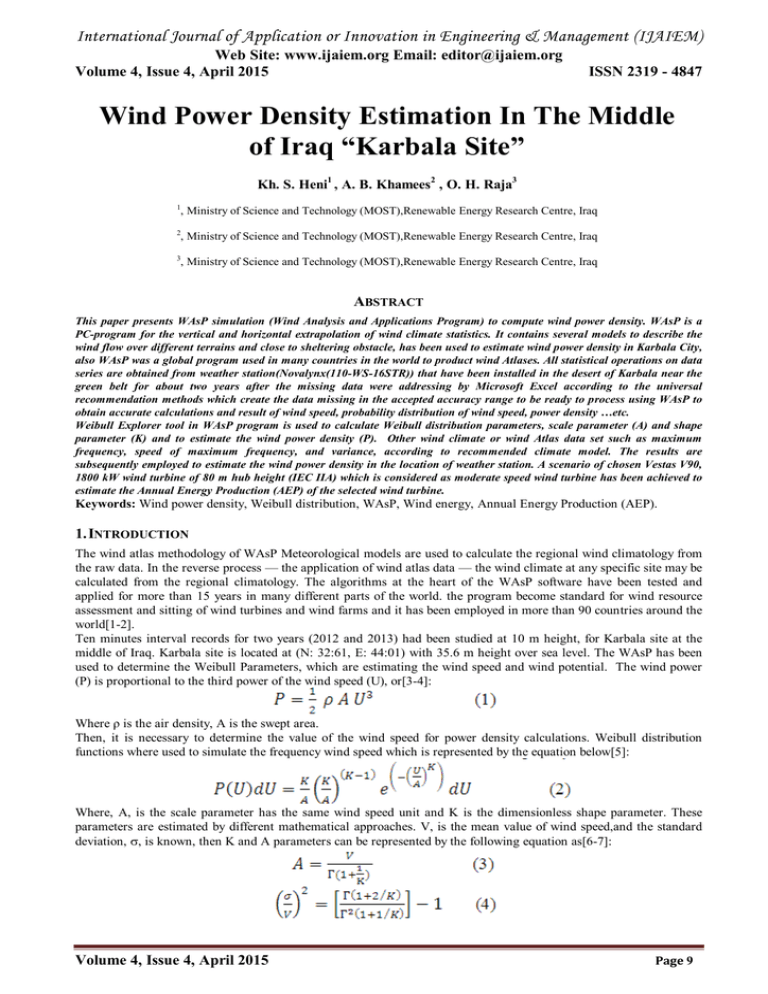
International Journal of Application or Innovation in Engineering & Management (IJAIEM) Web Site: www.ijaiem.org Email: editor@ijaiem.org Volume 4, Issue 4, April 2015 ISSN 2319 - 4847 Wind Power Density Estimation In The Middle of Iraq “Karbala Site” Kh. S. Heni1 , A. B. Khamees2 , O. H. Raja3 1 , Ministry of Science and Technology (MOST),Renewable Energy Research Centre, Iraq 2 , Ministry of Science and Technology (MOST),Renewable Energy Research Centre, Iraq 3 , Ministry of Science and Technology (MOST),Renewable Energy Research Centre, Iraq ABSTRACT This paper presents WAsP simulation (Wind Analysis and Applications Program) to compute wind power density. WAsP is a PC-program for the vertical and horizontal extrapolation of wind climate statistics. It contains several models to describe the wind flow over different terrains and close to sheltering obstacle, has been used to estimate wind power density in Karbala City, also WAsP was a global program used in many countries in the world to product wind Atlases. All statistical operations on data series are obtained from weather station(Novalynx(110-WS-16STR)) that have been installed in the desert of Karbala near the green belt for about two years after the missing data were addressing by Microsoft Excel according to the universal recommendation methods which create the data missing in the accepted accuracy range to be ready to process using WAsP to obtain accurate calculations and result of wind speed, probability distribution of wind speed, power density …etc. Weibull Explorer tool in WAsP program is used to calculate Weibull distribution parameters, scale parameter (A) and shape parameter (K) and to estimate the wind power density (P). Other wind climate or wind Atlas data set such as maximum frequency, speed of maximum frequency, and variance, according to recommended climate model. The results are subsequently employed to estimate the wind power density in the location of weather station. A scenario of chosen Vestas V90, 1800 kW wind turbine of 80 m hub height (IEC IIA) which is considered as moderate speed wind turbine has been achieved to estimate the Annual Energy Production (AEP) of the selected wind turbine. Keywords: Wind power density, Weibull distribution, WAsP, Wind energy, Annual Energy Production (AEP). 1. INTRODUCTION The wind atlas methodology of WAsP Meteorological models are used to calculate the regional wind climatology from the raw data. In the reverse process — the application of wind atlas data — the wind climate at any specific site may be calculated from the regional climatology. The algorithms at the heart of the WAsP software have been tested and applied for more than 15 years in many different parts of the world. the program become standard for wind resource assessment and sitting of wind turbines and wind farms and it has been employed in more than 90 countries around the world[1-2]. Ten minutes interval records for two years (2012 and 2013) had been studied at 10 m height, for Karbala site at the middle of Iraq. Karbala site is located at (N: 32:61, E: 44:01) with 35.6 m height over sea level. The WAsP has been used to determine the Weibull Parameters, which are estimating the wind speed and wind potential. The wind power (P) is proportional to the third power of the wind speed (U), or[3-4]: Where ρ is the air density, A is the swept area. Then, it is necessary to determine the value of the wind speed for power density calculations. Weibull distribution functions where used to simulate the frequency wind speed which is represented by the equation below[5]: Where, A, is the scale parameter has the same wind speed unit and K is the dimensionless shape parameter. These parameters are estimated by different mathematical approaches. V, is the mean value of wind speed,and the standard deviation, , is known, then K and A parameters can be represented by the following equation as[6-7]: Volume 4, Issue 4, April 2015 Page 9 International Journal of Application or Innovation in Engineering & Management (IJAIEM) Web Site: www.ijaiem.org Email: editor@ijaiem.org Volume 4, Issue 4, April 2015 ISSN 2319 - 4847 Γ, represents a general Gamma function,and K can be evaluated explicitly as[4]: 2. METHODOLOGY To calculate the Weibull distribution probability for wind speed and the mean wind speed, real data must be available. The real data can be recorded by the data logger. Wind data includes wind speed and direction with fixed interval. The weather station has to install far away from any obstacles like buildings and trees. Tow heights (10 m and 30 m) has been chose to install the weather station to get the desired data for each level at the same site, the first level is a global level for measuring the meteorological data, while the second level is selected because the wind at this altitude has almost laminar flow. A comparison is a achieved between the selected levels to get an imagination for each one with respect to the power density, wind speed, and Weibull parameters (A, K). A scenario of estimating wind climate set at 80 m height and a simulation of operating Vestas V90 (1800kW) wind turbine have been achieved to calculate the Annual Energy Production (AEP) of the selected wind turbine. 3. RESULTS AND DISCUSSION The data has been analyzed using WAsP, to get a statistical summary. The mean wind speed is calculated from the Observed Mean Wind Climate as well as, K and A parameters of Weibull distribution and the power density for the location. Wind rose of the location at (10 m, 30 m, and 80 m) has been achieved; it is divided into 12 sectors, each one represents 30o. Figure 1 (a, b, and c) shows the wind rose for the heights 10m, 30m, and 80m respectively, it is evidence that the dominate wind direction at 330o , which means North West direction, then power density has the majority value for this direction. (a) (b) (c) Figure 1 The wind rose of Karbala site at : (a) 10 m, (b) 30 m, and (c) 80 m. Weibull parameters of all sectors of the wind rose are determined to be use in the Weibull distribution calculation within the WAsP [8-9]. The results in Table 1 shows the maximum power density, speed of maximum power density, median speed, speed of maximum frequency, and the variance, for the three studied heights 10m, 30m, and 80m. Table 1: Results of the Weibull distribution calculations10 m, 30m, and 80m hieghts. Volume 4, Issue 4, April 2015 Page 10 International Journal of Application or Innovation in Engineering & Management (IJAIEM) Web Site: www.ijaiem.org Email: editor@ijaiem.org Volume 4, Issue 4, April 2015 ISSN 2319 - 4847 Figure 2(a) shows the relationship between the wind speed frequency and the wind speed at 10 m height while Figure 2 (b) shows the relationship between the power density and the wind speed at 10 m height for all sectors (emergent). (a) (b) Figure 2 (a) Wind value frequency vs. wind speed, and (b) the power density vs. wind speed at 10 m. Results for each sector of the wind rose have been obtained from WAsP climate analyst for comparison, as shown in Table 2. The power density at the sectors 1, and 12 are distinguished during the studied period because the dominance of wind direction. Figure 3, shows the frequency as a function to wind speed by curves and histogram for all (emergent) with a fitted curve of scale parameter A (4.6 m/s), and shape parameter K (1.64) in Karbala site at 10 m height. Table 2: Results obtained from climate analyst at 10 m height. Sect No. Wind Climate Angle (°) 1 0 2 30 3 60 4 90 5 120 6 150 7 180 8 210 9 240 10 270 11 300 12 330 All (emergent) Freq. (%) 17.6 7.0 6.4 5.4 4.7 4.0 2.9 2.4 2.7 4.4 12.2 30.2 Power A (m/s) 5.3 2.9 2.2 2.2 3.5 4.4 4.0 2.6 2.0 2.5 4.6 6.3 K 2.66 1.91 1.32 1.41 1.34 1.55 1.2 1.06 1.28 1.25 1.69 2.23 (U) (m/s) 4.68 2.61 1.98 1.96 3.18 4.00 3.76 2.52 1.85 2.29 4.13 5.60 4.07 P 2 (W/m ) 95 22 16 14 64 101 129 51 14 27 100 186 102 Figure 3 The curve and histogram of wind speed frequency of Karbala site at 10 m height. The power density is low, it can be classified in class (1) to class (2) of wind classes at 10 m (33ft) height, which are started below (100 W/m2) up to more than (400W/m2). This result is due to the existing location of weather station in Karbala’s area under the effect of surface topography at 10 m, therefore, the weather station height has been taken to Volume 4, Issue 4, April 2015 Page 11 International Journal of Application or Innovation in Engineering & Management (IJAIEM) Web Site: www.ijaiem.org Email: editor@ijaiem.org Volume 4, Issue 4, April 2015 ISSN 2319 - 4847 higher altitude (30 m), to obtain higher power. Areas are often described by their "wind class" ranking, rather than their range of Wind Power Densities WPD or mean wind speeds. Table 3 shows the ranges of WPD and associated classes, at 10 meters height above ground[10]. Table 3: Wind power density and associated classes at 10 m height. Wind Power Class at 10m(33ft) 1 2 3 4 5 6 7 Wind Density (W/m2) <100 100-150 150-200 200-250 250-300 300-400 >400 Power Mean Speed range (b) m/s (mph) <4.4 (9.8) 4.4 (9.8)/5.1 (11.5) 5.1(11.5)/5.6(12.5) 5.6(12.5)/6.0(13.4) 6.0(13.4)/6.4(14.3) 6.4(14.3)/7.0(15.7) >7.0 (15.7) As shown in Figure 1- (b), previously. The wind rose shows that the wind direction at (30 m) has almost the same behavior with compare with that at (10 m), that means the change in the position of the weather station height has a slight influence in general and the dominant wind direction has not changed. Table 1 is shown Weibull parameters (A, K) at 30 m height, too, these parameters are used in the Weibull distribution calculations to determine the max power density, speed of maximum power density, median speed, speed of maximum frequency, and the Variance which are obtained from WAsP climate analyst. Figure 4 (a) and (b), shows the relationship between the wind speed frequency vs. the wind speed, and the relationship between the power densities vs. The wind speed at 30 m height for all sectors (emergent), respectively. Figure 4 (a) Wind value frequency vs. wind speed, (b) Power density vs. wind speed at 30 m. Results for each sector of the wind rose have been obtained from WAsP climate analyst for comparison, as shown in Table 4. It is evidence that the power density which is obtained at (30 m) is increased according to the increasing of wind speed. The power density is about (164 W/m2), associated with wind speed equal (4.88 m/s) for all (emergent), this value of power density is generally be classified into class 3 as listed in Table 3, the wind resource may fall into higher class category in some cases. Figure 5, shows the frequency as a function to wind speed by curves for all (emergent) with combined curve of scale parameter A (5.5 m/s), and shape parameter K (1.69) in Karbala site at 30 m height. Table 4: Results obtained from climate analyst at 30m height. Sect Wind Climate P (W/m Angle Freq. A (U) No. 1 2 3 4 5 6 7 8 9 10 Volume 4, Issue 4, April 2015 (°) 0 30 60 90 120 150 180 210 240 270 (%) 17.1 7.9 6.4 5.4 4.7 4.0 2.8 2.4 2.8 4.9 (m/s) 6.3 4.1 2.8 2.7 4.0 5.2 4.7 3.2 2.6 3.4 K 2.71 1.72 1.60 1.57 1.42 1.67 1.25 1.15 1.39 1.38 (m/s) 5.61 3.65 2.53 2.39 3.64 4.63 4.41 3.04 2.37 3.11 2 ) 161 67 25 21 87 143 194 74 25 57 Page 12 International Journal of Application or Innovation in Engineering & Management (IJAIEM) Web Site: www.ijaiem.org Email: editor@ijaiem.org Volume 4, Issue 4, April 2015 11 300 12 330 All(emergent) 13.0 28.6 5.9 7.5 1.90 2.31 5.22 6.62 4.88 ISSN 2319 - 4847 176 297 164 Figure 5 The curve of wind speed frequency at 30 m height. Again, by using WAsP, theoretical estimation of wind data for an 80 m height has been carried out, too. This altitude represents the hub height of Vestas V90 (1800 kW) (80m, IEC IIA) which is considered as moderate speed wind turbine. A scenario of chosen wind turbine has been achieved to estimate the Annual Energy Production (AEP) of the selected wind turbine V90. Figure 6 (a) shows the wind value frequency vs. wind speed, and Figure 6 (b) shows the power density vs. wind speed at 80 m for all sectors in Karbala site. Table 5 shows the results of this scenario. The wind rose of the location at 80 m is shown previously in Figure 1 (c), while Figure 7 shows the relationship between the wind frequencies vs. the corresponding wind speed. (a) Figure 6 (a) Wind value frequency vs. wind speed, (b) (b) Power density vs. wind speed at 80 m. Table 5 Results obtained from V90 wind turbine with 80m hub height. Wind Climate Angle Freq. (°) (%) 0 13.0 30 4.6 60 4.6 90 4.2 120 7.4 150 4.8 180 3.0 210 2.6 240 3.6 270 6.0 300 17.0 330 29.2 All (emergent) Volume 4, Issue 4, April 2015 Power A (m/s) 7.8 4.0 3.2 3.2 6.1 6.7 4.6 3.5 3.8 4.0 6.5 9.0 K 2.55 1.74 1.44 1.60 1.54 1.63 1.35 1.27 1.26 1.44 1.87 2.63 (U) (m/s) 6.91 3.57 2.94 2.86 5.50 5.96 4.23 3.23 3.49 3.64 5.80 8.01 5.89 P 2 (W/m ) 314 62 45 36 267 315 149 74 95 85 246 480 279 AEP (GWh) 0.804 0.060 0.040 0.029 0.304 0.229 0.075 0.036 0.061 0.100 0.759 2.343 4.839 Page 13 International Journal of Application or Innovation in Engineering & Management (IJAIEM) Web Site: www.ijaiem.org Email: editor@ijaiem.org Volume 4, Issue 4, April 2015 ISSN 2319 - 4847 Figure 7 The wind speed frequency vs. the wind speed. The power curve density vs. Wind speed at Karbala site and the power density rose for the same site has been calculated as shown in Figure 8 (a) and (b), respectively . (a) (b) Figure 8 (a)The wind speed frequency vs. the wind speed, and the power density rose (b), for Karbala site. The Annual Energy Production (AEP) has been estimated for the site according to the specifications of the selected wind turbine (Vestas V90, 1800 kW) at 80 m height Figure 9 (a) , as well as the AEP rose at 80 m height in the same region as shown in Figure 9 (b). (a) (b) Figure 9 AEP curve of V90 (a) , and AEP rose for Karbala site at 80 m height. Volume 4, Issue 4, April 2015 Page 14 International Journal of Application or Innovation in Engineering & Management (IJAIEM) Web Site: www.ijaiem.org Email: editor@ijaiem.org Volume 4, Issue 4, April 2015 ISSN 2319 - 4847 4 CONCLUSION Power density has been calculated for each sector as mentioned previously. Weibull distribution varied from sector to sector according to shape parameter (k), the location parameter (g) equal to zero so all log curves are starting from original point, and, the scale parameter is almost about the mean wind speed. It is found that the total power density, wind speed, Weibull parameters A and K for all (emergent) at Karbala site at 10 m height are (102 W/m2), (4.1 m/s), (4.6 m/s), and (1.64) respectively, and, at 30 m height are (167 w/m2), (4.9 m/s), (5.5 m/s), and (1.69) respectively, this power density is low as compared with other areas, and this power density can be classified in class (2) of wind classes at 10 m (33ft) height, which are started below (100 W/m2) up to more than (400 W/m2), while, at 80 m height are (279 W/m2), (5.89 m/s), (6.6 m/s), and (1.74) respectively. For the same hub height (80 m) the AEP is (4.839 GWh) by selecting (Vestas V90, 1800 kW) wind turbine at this site. When the weather station position changed to higher altitude the power density increased in accordance to the increasing of the wind speed, while the wind direction almost not affected by changing the altitude, this due to the flat surface of the study area, then, it is recommended to change the weather station position to higher altitude, to produce higher power density to rise to higher class category The Annual Energy Production (AEP), can be estimated for any type of wind turbine when its specifications are available. REFERENCES [1] A. J. Bowen and N. G. Mortensen, "Exploring the limits of WAsP: the wind atlas analysis and application program," in Proceedings of the 1996 European Union Wind Energy Conference, Göteborg, Sweden, pp. 20-24, May, 1996. [2] N. G. Mortensen, et al., "Getting started with WAsP8," Risø National Laboratory,Denmark, 2003. [3] E. Hau and H. von Renouard, Wind Turbines: Fundamentals, Technologies, Application, Economics: Springer, 2013. [4] A. D. Sahin, Ed., Renewable Energies (Lecture Notes of the International Advanced Course on Renewable Energies. Istanbul, Turkey, June, 2006. [5] R. O. Fagbenle, et al., "Assessment of wind energy potential of two sites in North-East, Nigeria," Renewable Energy, (36), pp. 1277-1283, 2011. [6] K. Sukkiramathi, et al., "A Study of Weibull Distribution to Analyze the Wind Speed at Jogimatti in India,",(1), 2014. [7] S. A. Akdağ and A. Dinler, "A new method to estimate Weibull parameters for wind energy applications," Energy Conversion and Management, (50), pp. 1761-1766, 2009. [8] L. Landberg, et al., "Wind Resource Estimation—An Overview," Wind Energy, (6), pp. 261-271, 2003. [9] N. G. Mortensen , et al,"Wind atlas analysis and application program (WAsP) ", in Technical Report Risø-I666(EN),(v.2) User's guide, R. N. Laboratory, Ed., ed. Roskilde, Denmark, 1993. [10] T. Hughes, "Lesson Number 1. in an Oklahoma Wind Power Tutorial Series," The University of Oklahoma, 2000. AUTHORS Khalid Sami Heni received the B.Sc. and M.Sc. in Science of Physics from Baghdad University in 1999 and 2002 respectively. During 2002-2015, he stayed in Ministry of Science and Technology , Iraq, to study Renewable Energy , Wind energy. Ahmed Bader Khamees received the B.Sc. degree in Science of Physics from Baghdad University in 1987 and M.Sc. degree in Physics (Applied Physics) in 2000 from Technecal University. During 1987-2015, he stayed in Ministry of Science and Technology , Iraq, to work in Material Science, Renewable Energy and Wind Energy. Omar Hussein Raja received the B.Sc. degree in Science of Physics from Baghdad University in 1987 and M.Sc. degree in Physics (Applied Physics) in 2000 from Technecal University. During 19932015, he stayed in Ministry of Science and Technology , Iraq, to work in Electro Optics, and Renewable Energy ( Wind and Solar Energy). Volume 4, Issue 4, April 2015 Page 15

