International Journal of Application or Innovation in Engineering & Management...
advertisement
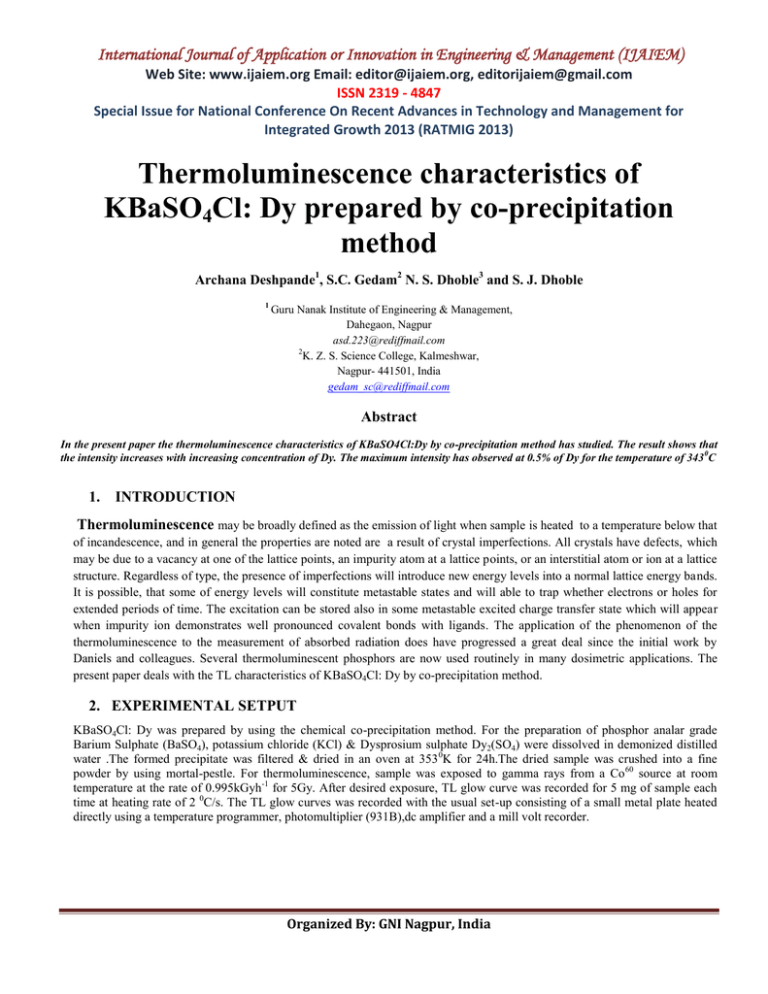
International Journal of Application or Innovation in Engineering & Management (IJAIEM) Web Site: www.ijaiem.org Email: editor@ijaiem.org, editorijaiem@gmail.com ISSN 2319 - 4847 Special Issue for National Conference On Recent Advances in Technology and Management for Integrated Growth 2013 (RATMIG 2013) Thermoluminescence characteristics of KBaSO4Cl: Dy prepared by co-precipitation method Archana Deshpande1, S.C. Gedam2 N. S. Dhoble3 and S. J. Dhoble 1 Guru Nanak Institute of Engineering & Management, Dahegaon, Nagpur asd.223@rediffmail.com 2 K. Z. S. Science College, Kalmeshwar, Nagpur- 441501, India gedam_sc@rediffmail.com Abstract In the present paper the thermoluminescence characteristics of KBaSO4Cl:Dy by co-precipitation method has studied. The result shows that the intensity increases with increasing concentration of Dy. The maximum intensity has observed at 0.5% of Dy for the temperature of 343 0C 1. INTRODUCTION Thermoluminescence may be broadly defined as the emission of light when sample is heated to a temperature below that of incandescence, and in general the properties are noted are a result of crystal imperfections. All crystals have defects, which may be due to a vacancy at one of the lattice points, an impurity atom at a lattice points, or an interstitial atom or ion at a lattice structure. Regardless of type, the presence of imperfections will introduce new energy levels into a normal lattice energy bands. It is possible, that some of energy levels will constitute metastable states and will able to trap whether electrons or holes for extended periods of time. The excitation can be stored also in some metastable excited charge transfer state which will appear when impurity ion demonstrates well pronounced covalent bonds with ligands. The application of the phenomenon of the thermoluminescence to the measurement of absorbed radiation does have progressed a great deal since the initial work by Daniels and colleagues. Several thermoluminescent phosphors are now used routinely in many dosimetric applications. The present paper deals with the TL characteristics of KBaSO4Cl: Dy by co-precipitation method. 2. EXPERIMENTAL SETPUT KBaSO4Cl: Dy was prepared by using the chemical co-precipitation method. For the preparation of phosphor analar grade Barium Sulphate (BaSO4), potassium chloride (KCl) & Dysprosium sulphate Dy2(SO4) were dissolved in demonized distilled water .The formed precipitate was filtered & dried in an oven at 353 0K for 24h.The dried sample was crushed into a fine powder by using mortal-pestle. For thermoluminescence, sample was exposed to gamma rays from a Co 60 source at room temperature at the rate of 0.995kGyh-1 for 5Gy. After desired exposure, TL glow curve was recorded for 5 mg of sample each time at heating rate of 2 0C/s. The TL glow curves was recorded with the usual set-up consisting of a small metal plate heated directly using a temperature programmer, photomultiplier (931B),dc amplifier and a mill volt recorder. Organized By: GNI Nagpur, India International Journal of Application or Innovation in Engineering & Management (IJAIEM) Web Site: www.ijaiem.org Email: editor@ijaiem.org, editorijaiem@gmail.com ISSN 2319 - 4847 Special Issue for National Conference On Recent Advances in Technology and Management for Integrated Growth 2013 (RATMIG 2013) 3. THEORY The essential condition for thermoluminescence to occur in a solid is that the material must have been previously exposed to radiation. This radiation is the source of energy; whereas the heating is just a trigger to help release the absorbed energy. So, the term “Thermally Stimulated Luminescence” is more accurate; however, “thermoluminescence” has become the common term. Based on the energy band model [7, 8], the quantitative theory for thermoluminescence is developed [9, 10, 11, 12]. A schematic representation of the simple model for thermoluminescence discussed by above pioneers is shown in figure 3.3. There are just two localized energy levels. One acts as trapping state (metastable state), which is close to the conduction band The other one acts as recombination center (ground state), which is close to the valence band. When absorbing the energy from radiation, the electrons in valence band are excited to the conduction band, producing free electrons in the conduction band and free holes in the valence band. The free holes may be tapped in the recombination center and the free electrons may become trapped in the trapping state. From thermodynamic arguments, the average time spent by electrons in the trapping state at temperature T is given by: = s-1exp(E / kT) (3.1) Where, s is a constant (called frequency factor) and E is the energy difference between conduction band and trapping state (called the trap depth); k is Boltzmann’s constant. We can rewrite this equation as follow: p = -1 = s exp (-E / kT) (3.2) Here, p is defined as the probability per unit time of the release of an electron from the trap. All other terms remain as previously defined. From equations (3.1) and (3.2), if the trap depth E is such that at the temperature of radiation, T0, E >> kT0, then any electron which becomes trapped will remain so for a long period of time. Even after removal of the radiation there will exist a substantial population of trapped electrons. Although the free electrons always have the trend to return to the conduction band (An), the relaxation rate is very low and this metastable state will exist for an indefinite period. However, the rate can be increased by raising the temperature of the specimen above T 0 such that E <= kT. Thus the probability of de-trapping p is increased and the electrons will be release from the trap into the conduction band. Thermoluminescence then results from the free electrons recombining with the trapped holes at the recombination center. Figure1: OTOR model Organized By: GNI Nagpur, India International Journal of Application or Innovation in Engineering & Management (IJAIEM) Web Site: www.ijaiem.org Email: editor@ijaiem.org, editorijaiem@gmail.com ISSN 2319 - 4847 Special Issue for National Conference On Recent Advances in Technology and Management for Integrated Growth 2013 (RATMIG 2013) 4. RESULTS AND DISCUSSIONS Fig.2 shows typical glow curves of KBaSO4Cl: Dy exposed to 5 Gy of gamma rays from a Co60source. It can be seen in this figure that the sample KBaSO4Cl: Dy has an intense single peak appearing at 343 0C for various concentrations of Dy (0.5mol%, 0.2mol%, 0.3mol% & 0.1mol %). TL intensity increases for the increasing concentrations of Dy. The peak positions of glow curves are at the same places. In TL theory, the peak temperature of glow peaks is expected to change only with a heating rate for first order of kinetics (b=1). Hence, for a constant heating rate, the peak temperature should not be affected by other experimental parameters and should thus be fairly constant within the limit of experimental errors As seen from Fig. 2, there is no significant change in the position of peak temperature This point indicates that observed peaks in the glow curve of KBaSO4Cl: Dy follows first-order kinetics. 350 343 300 Intensity 250 200 150 100 50 0 0 100 200 300 400 Temperature Figure2: TL glow curve of KBaSO4Cl: Dy 5. CONCLUSION In order to understand Thermoluminescence mechanism, effects of, Dy doped KBaSO4Cl the shape of TL glow curve, TL spectra were investigated. The result shows that the intensity increases with increasing concentration of Dy The maximum intensity has observed at 0.5% of Dy for the temperature of 343 0C.For dosimetry purposes it is desirable for the detector is characterized by a glow curve with a peak at around 200-2500C.So, the present phosphor may not be use for dosimetry purposes. References: [1]S.W.S. McKeever, Thermoluminescence of Solids, Cambridge University Press, Cambridge, 1985 Organized By: GNI Nagpur, India International Journal of Application or Innovation in Engineering & Management (IJAIEM) Web Site: www.ijaiem.org Email: editor@ijaiem.org, editorijaiem@gmail.com ISSN 2319 - 4847 Special Issue for National Conference On Recent Advances in Technology and Management for Integrated Growth 2013 (RATMIG 2013) [2] A.J.J.Bos, Nuclear Instruments and Methods in Physics Research B 184(2001)3-28 [3] DosimetryJ. W. Poston, Sr. Texas A. & M. University [4] LuminescenceJ. N. Demas S. E. Demas University of Virginia [5] Mihkel Kerikmae, Some lumninescent materials for dosimetric applications and physical research, dissertations chimicae universitaties tartuensis [6] Jianwei Wang, Thermoluminescence excitation spectroscopy: a technique to study energy levels of impurity in solids [7] R. P. Johnson, J. Opt. Soc. Am., 29 (1939) 387. [8] F. E. Williams, J. Opt. Soc. Am., 39 (1949) 648 [9] G. F .J. Garlick, M. H .F. Wilkins, Proc. Roy. Soc. Lond., 184 (1945) 408. [10] J. T. Randall, M .H. F. Wilkins, Proc. Roy. Soc. Lond., 184 (1945) 366. [11] J. T. Randall, M .H. F. Wilkins, Proc. Roy. Soc. Lond., 184 (1945) 390. [12]G. F. J. Garlick, A. F. Gibson, Proc. Phys. Soc., 60 (1948) 574. Organized By: GNI Nagpur, India
