Critical parameters for the disorder-induced metal-insulator transition in FCC and...
advertisement
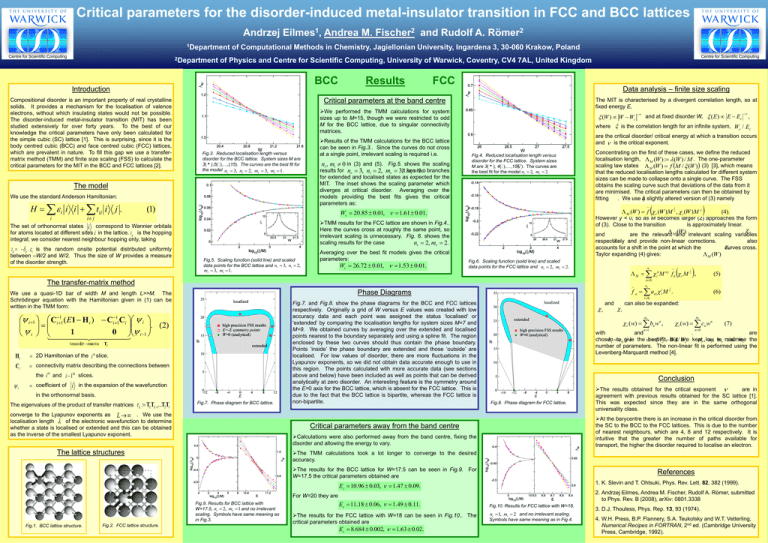
Critical parameters for the disorder-induced metal-insulator transition in FCC and BCC lattices Andrzej Eilmes1, Andrea M. Fischer2 and Rudolf A. Römer2 1Department 2Department of Computational Methods in Chemistry, Jagiellonian University, Ingardena 3, 30-060 Krakow, Poland of Physics and Centre for Scientific Computing, University of Warwick, Coventry, CV4 7AL, United Kingdom BCC Summary Introduction We use a simple localised spin model to study how the magnetic Compositional disorder is an important of real We crystalline properties of ferromagnets depend uponproperty temperature. derive solids. It provides a mechanism for the localisation valence the temperature dependence of magnetisation usingofboth the electrons,Heisenberg without which insulating states wouldmechanical not be possible. classical model and the quantum Ising The disorder-induced metal-insulator transition (MIT) anisotropy has been model. For a system with uniaxial magnetocrystalline studied, we extensively for over forty years. To theitsbest of our (MCA) adopt a mean field approach to calculate anisotropy knowledge critical parameters have only for energy (thethe difference in free energy whenbeen it iscalculated magnetised the simple (SC) latticeto[1]. surprising, it is the the parallel andcubic perpendicular its This easyisaxis). We since see that body centred cubic (BCC) (FCC) lattices, single-ion anisotropy model and doesface not centred give thecubic correct temperature which are prevalent nature. To fill thisforgap we usetemperature a transferdependence of the in anisotropy energy a large matrix method (TMM) andthe finite size scaling (FSS)ifto calculate the range. However, we find correct dependence the anisotropy critical parameters for the MITconstant in the BCC and FCC latticesthe [2]. two is present in the exchange instead. Allowing different kinds of anisotropy to favour different directions of magnetisation, enables us to model a temperature induced spin Themain model reorientation transition. Our effort involves extending our model to more than one layer, seeking agreement with results for We use the standard Anderson Hamiltonian: layers of cobalt obtained using an extension of the relativistic disordered local moments scheme [1]. H i i i tij i j . Data analysis – finite size scaling The MIT is characterised by a divergent correlation length, so at fixed energy E, We performed the TMM calculations for system sizes up to M=15, though we were restricted to odd M for the BCC lattice, due to singular connectivity matrices. Fig.3. Reduced localisation length versus disorder for the BCC lattice. System sizes M are 3(h),5(z),…,(15). The curves are the best fit for the model n 3, n 2, m 3, m 1. r i r i Results of the TMM calculations for the BCC lattice can be seen in Fig.3.. Since the curves do not cross at a single point, irrelevant scaling is required i.e. ni , mi 0 in (3) and (5). Fig.5. shows the scaling results for nr 3, ni 2, mr 3,It m has two branches i 1. for extended and localised states as expected for the MIT. The inset shows the scaling parameter which diverges at critical disorder. Averaging over the models providing the best fits gives the critical parameters as: (1) Fig.5. Scaling function (solid line) and scaled data points for the BCC lattice and nr 3, ni 2, mr 3, mi 1. Averaging over the best fit models gives the critical parameters: Wc 26.72 0.01, 1.53 0.01. Fig.4. Reduced localisation length versus disorder for the FCC lattice. System sizes M are 3(h), 4(z),…,15(). The curves are the best fit for the model nr 2, mr 2. Concentrating on the first of these cases, we define the reduced localisation length, M (W ) : (W ) / M . The one-parameter scaling law states M (W ) f M / (W ) (3) [3], which means that the reduced localisation lengths calculated for different system sizes can be made to collapse onto a single curve. The FSS obtains the scaling curve such that deviations of the data from it are minimised. The critical parameters can then be obtained by fitting . We use a slightly altered version of (3) namely ~ transfer matrix Fig.6. Scaling function (solid line) and scaled data points for the FCC lattice and nr 2, mr 2. ni M M Hi Ci i 2D Hamiltonian of the i th slice. connectivity matrix describing the connections between the i th and i 1th slices. coefficient of i in the expansion of the wavefunction in the orthonormal basis. The eigenvalues of the product of transfer matrices L : TLTL1...T2T1 Fig.7. Phase diagram for BCC lattice. converge to the Lyapunov exponents as L . We use the localisation length of the electronic wavefunction to determine whether a state is localised or extended and this can be obtained as the inverse of the smallest Lyapunov exponent. Fig.7. and Fig.8. show the phase diagrams for the BCC and FCC lattices respectively. Originally a grid of W versus E values was created with low accuracy data and each point was assigned the status ‘localised’ or ‘extended’ by comparing the localisation lengths for system sizes M=7 and M=9. We obtained curves by averaging over the extended and localised points nearest to the boundary separately and using a spline fit. The region enclosed by these two curves should thus contain the phase boundary. Points ‘inside’ the phase boundary are extended and those ‘outside’ are localised. For low values of disorder, there are more fluctuations in the Lyapunov exponents, so we did not obtain data accurate enough to use in this region. The points calculated with more accurate data (see sections above and below) have been included as well as points that can be derived analytically at zero disorder. An interesting feature is the symmetry around the E=0 axis for the BCC lattice, which is absent for the FCC lattice. This is due to the fact that the BCC lattice is bipartite, whereas the FCC lattice is non-bipartite. i 0 r ~ fn r M ny 1 , 1 (5) (6) can also be expanded: n 1 mi i (w) cn wn (7) n 0 with and . are chosen but are kept nr , low ni , to mr minimise and mi the b1 toc0 give 1 the wbest (Wfit, c W ) / Wc number of parameters. The non-linear fit is performed using the Levenberg-Marquardt method [4]. Conclusion Fig.8. Phase diagram for FCC lattice. The results obtained for the critical exponent are in agreement with previous results obtained for the SC lattice [1]. This was expected since they are in the same orthogonal universality class. At the barycentre there is an increase in the critical disorder from the SC to the BCC to the FCC lattices. This is due to the number of nearest neighbours, which are 4, 8 and 12 respectively. It is intuitive that the greater the number of paths available for transport, the higher the disorder required to localise an electron. Calculations were also performed away from the band centre, fixing the disorder and allowing the energy to vary. The TMM calculations took a lot longer to converge to the desired accuracy. References 1. K. Slevin and T. Ohtsuki, Phys. Rev. Lett. 82, 382 (1999). Ec 10.96 0.03, 1.47 0.09. 2. Andrzej Eilmes, Andrea M. Fischer, Rudolf A. Römer, submitted to Phys. Rev. B (2008), arXiv: 0801.3338 For W=20 they are Fig.9. Results for BCC lattice with W=17.5, nr 2, mr 1 and no irrelevant scaling. Symbols have same meaning as in Fig.3. Fig.2. FCC lattice structure. i i r r (w) bn wn , The results for the BCC lattice for W=17.5 can be seen in Fig.9. For W=17.5 the critical parameters obtained are Fig.1. BCC lattice structure. and mr Critical parameters away from the band centre The lattice structures nr n i f n ani M . Phase Diagrams Ti (4). and i and provide non-linear corrections. respectively also curves accounts for a shift in the point at which the cross. i Taylor expanding (4) gives: M (W ) ~ i 1 C ( E1 H i ) C Ci i . ( 2 ) 0 i 1 i 1 r (W ) are the relevant Mand irrelevant scaling variables n 0 1 i 1 1 However y < 0, so as M becomes larger (2) approaches the form of (3). Close to the transition is approximately linear. The transfer-matrix e method 1 i 1 M (W ) f r (W ) M , i (W ) M y im e We use a quasi-1D bar of width M and length L>>M. The Schrödinger equation with the Hamiltonian given in (1) can be written in the TMM form: are the critical disorder/ critical energy at which a transition occurs and is the critical exponent. TMM results for the FCC lattice are shown in Fig.4.. Here the curves cross at roughly the same point, so irrelevant scaling is unnecessary. Fig. 6. shows the scaling results for the case nr 2, mr 2. tij ij . i is the random onsite potential distributed uniformly and at fixed disorder W, ( E ) E Ec , (W ) W Wc where is the correlation length for an infinite system, Wc / Ec Wc 20.85 0.01, 1.61 0.01. The set of orthonormal states i correspond to Wannier orbitals for atoms located at different sites i in the lattice. t ij is the hopping integral; we consider nearest neighbour hopping only, taking between –W/2 and W/2. Thus the size of W provides a measure of the disorder strength. FCC Critical parameters at the band centre i j i Results Ec 11.18 0.06, 1.49 0.11. The results for the FCC lattice with W=18 can be seen in Fig.10.. The critical parameters obtained are Ec 8.684 0.002, 1.63 0.02. Fig.10. Results for FCC lattice with W=18, nr 1, mr 2 and no irrelevant scaling. Symbols have same meaning as in Fig.4. 3. D.J. Thouless, Phys. Rep. 13, 93 (1974). 4. W.H. Press, B.P. Flannery, S.A. Teukolsky and W.T. Vetterling, Numerical Recipes in FORTRAN, 2nd ed. (Cambridge University Press, Cambridge, 1992).
