PERFORMANCE MEASURES Essex Engineering Essex is an industrial company with three divisions. Both the Midland Division and the North
advertisement
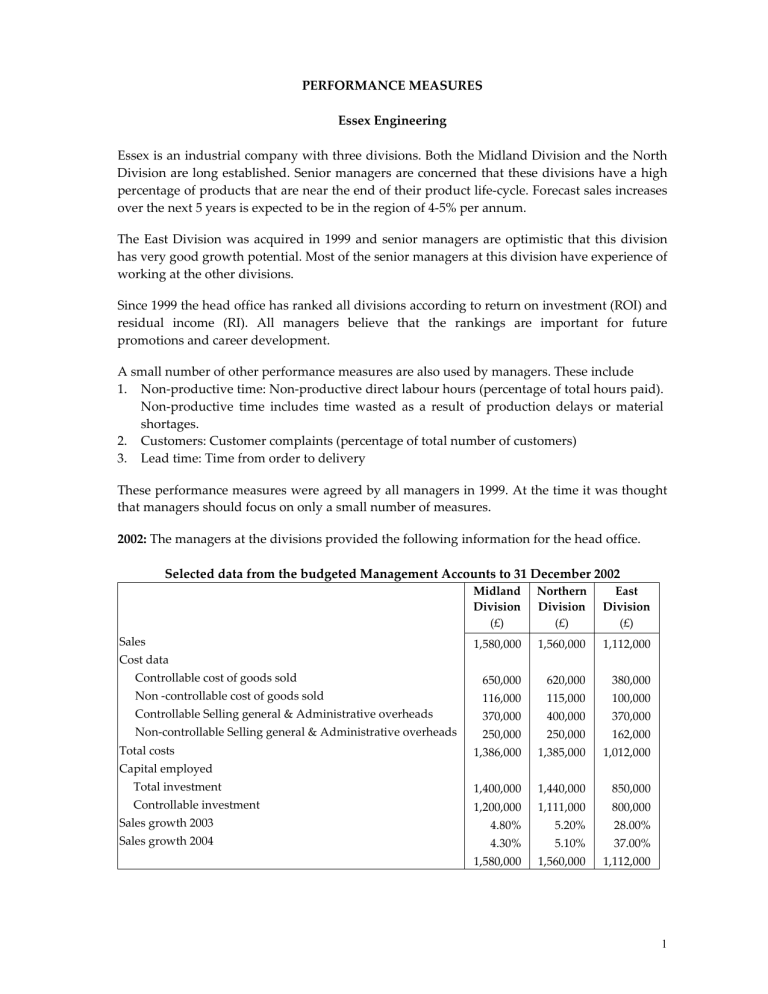
PERFORMANCE MEASURES Essex Engineering Essex is an industrial company with three divisions. Both the Midland Division and the North Division are long established. Senior managers are concerned that these divisions have a high percentage of products that are near the end of their product life‐cycle. Forecast sales increases over the next 5 years is expected to be in the region of 4‐5% per annum. The East Division was acquired in 1999 and senior managers are optimistic that this division has very good growth potential. Most of the senior managers at this division have experience of working at the other divisions. Since 1999 the head office has ranked all divisions according to return on investment (ROI) and residual income (RI). All managers believe that the rankings are important for future promotions and career development. A small number of other performance measures are also used by managers. These include 1. Non‐productive time: Non‐productive direct labour hours (percentage of total hours paid). Non‐productive time includes time wasted as a result of production delays or material shortages. 2. Customers: Customer complaints (percentage of total number of customers) 3. Lead time: Time from order to delivery These performance measures were agreed by all managers in 1999. At the time it was thought that managers should focus on only a small number of measures. 2002: The managers at the divisions provided the following information for the head office. Selected data from the budgeted Management Accounts to 31 December 2002 Midland Division (£) Northern Division (£) East Division (£) 1,580,000 1,560,000 1,112,000 Controllable cost of goods sold 650,000 620,000 380,000 Non ‐controllable cost of goods sold 116,000 115,000 100,000 Controllable Selling general & Administrative overheads 370,000 400,000 370,000 Sales Cost data Non‐controllable Selling general & Administrative overheads 250,000 250,000 162,000 1,386,000 1,385,000 1,012,000 Total investment 1,400,000 1,440,000 850,000 Controllable investment 1,200,000 1,111,000 800,000 Sales growth 2003 4.80% 5.20% 28.00% Sales growth 2004 4.30% 5.10% 37.00% 1,580,000 1,560,000 1,112,000 Total costs Capital employed 1 Other measures Non‐productive time: Non‐productive direct labour hours (percentage of total hours paid). Customer complaints number of customers) (percentage Lead time: Time from order to delivery of total 2001 Midland Division 4% Northern Division 4% East Division 6% 2002 2001 4.1% 1% 3.8% 1.2% 7.5% 5% 2002 2001 2002 1.1% 10 days 11 days 1.1% 9 days 9 days 6% 15 days 18 days The head office has estimated that the group cost of capital is 10% Ranking divisions in 2000 In 2000 the data on controllable and non‐controllable costs and investments will be used to rank divisions. Requirements: Question 1 Based on the data provided comment on the relative financial performance of the two divisions and discuss how the ranking of the divisions changes if controllable and non‐controllable costs and capital employed are analysed. Question 2 Evaluate the choice of performance measures for the 3 divisions Question 3 Identify and evaluate the difficulties faced by managers when measuring capital employed for a division. Question 4 Discuss how using ROI can result in managers making poor investment decisions. Question 5 Discuss the particular problems multinational companies have when evaluating the performance of divisions. Reference: McGraw‐Hill Higher Education http://highered.mcgraw-hill.com/sites/0077098595/student_view0/case_studies.html 2
