SOIL ORGANIC CARBON DYNAMICS UNDER A MOSAIC FOREST- K
advertisement

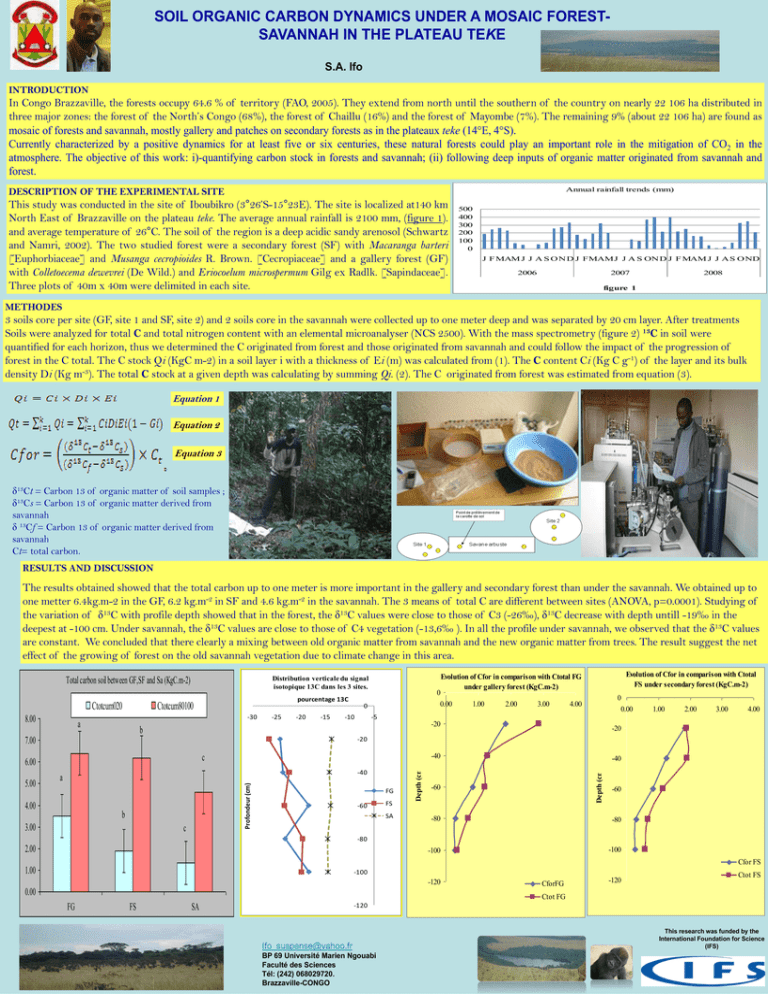
SOIL ORGANIC CARBON DYNAMICS UNDER A MOSAIC FORESTSAVANNAH IN THE PLATEAU TEKE S.A. Ifo INTRODUCTION In Congo Brazzaville, the forests occupy 64.6 % of territory (FAO, 2005). They extend from north until the southern of the country on nearly 22 106 ha distributed in three major zones: the forest of the North’s Congo (68%), the forest of Chaillu (16%) and the forest of Mayombe (7%). The remaining 9% (about 22 106 ha) are found as mosaic of forests and savannah, mostly gallery and patches on secondary forests as in the plateaux teke (14°E, 4°S). Currently characterized by a positive dynamics for at least five or six centuries, these natural forests could play an important role in the mitigation of CO2 in the atmosphere. The objective of this work: i)-quantifying carbon stock in forests and savannah; (ii) following deep inputs of organic matter originated from savannah and forest. DESCRIPTION OF THE EXPERIMENTAL SITE Annual rainfall trends (mm) This study was conducted in the site of Iboubikro (3°26’S-15°23E). The site is localized at140 km North East of Brazzaville on the plateau teke. The average annual rainfall is 2100 mm, (figure 1). and average temperature of 26°C. The soil of the region is a deep acidic sandy arenosol (Schwartz and Namri, 2002). The two studied forest were a secondary forest (SF) with Macaranga barteri [Euphorbiaceae] and Musanga cecropioides R. Brown. [Cecropiaceae] and a gallery forest (GF) with Colletoecema dewevrei (De Wild.) and Eriocoelum microspermum Gilg ex Radlk. [Sapindaceae]. Three plots of 40m x 40m were delimited in each site. 500 400 300 200 100 0 J F MAM J J A S O N D J FMAMJ J A S ON D J F MAM J J A S O ND 2006 2007 2008 figure 1 METHODES 3 soils core per site (GF, site 1 and SF, site 2) and 2 soils core in the savannah were collected up to one meter deep and was separated by 20 cm layer. After treatments Soils were analyzed for total C and total nitrogen content with an elemental microanalyser (NCS 2500). With the mass spectrometry (figure 2) 13C in soil were quantified for each horizon, thus we determined the C originated from forest and those originated from savannah and could follow the impact of the progression of forest in the C total. The C stock Qi (KgC m-2) in a soil layer i with a thickness of Ei (m) was calculated from (1). The C content Ci (Kg C g-1) of the layer and its bulk density Di (Kg m-3). The total C stock at a given depth was calculating by summing Qi. (2). The C originated from forest was estimated from equation (3). Equation 1 Equation 2 Equation 3 δ13Ct = Carbon 13 of organic matter of soil samples ; δ13Cs = Carbon 13 of organic matter derived from savannah δ 13Cf = Carbon 13 of organic matter derived from savannah Ct= total carbon. RESULTS AND DISCUSSION The results obtained showed that the total carbon up to one meter is more important in the gallery and secondary forest than under the savannah. We obtained up to one metter 6.4kg.m-2 in the GF, 6.2 kg.m-2 in SF and 4.6 kg.m-2 in the savannah. The 3 means of total C are different between sites (ANOVA, p=0.0001). Studying of the variation of δ13C with profile depth showed that in the forest, the δ13C values were close to those of C3 (-26‰), δ13C decrease with depth untill -19‰ in the deepest at -100 cm. Under savannah, the δ13C values are close to those of C4 vegetation (-13,6‰ ). In all the profile under savannah, we observed that the δ13C values are constant. We concluded that there clearly a mixing between old organic matter from savannah and the new organic matter from trees. The result suggest the net effect of the growing of forest on the old savannah vegetation due to climate change in this area. Total carbon soil between GF,SF and Sa (KgC.m-2) Ctotcum020 8.00 pourcentage 13C Ctotcum80100 -30 a -25 -20 -15 1.00 2.00 3.00 0 0.00 4.00 1.00 2.00 3.00 4.00 -5 -20 b -20 -20 7.00 -40 4.00 Profondeur (cm) a b 3.00 c FG -60 FS SA -40 Depth (cm) -40 Depth (cm) c 6.00 5.00 0 0.00 0 -10 Evolution of Cfor in comparison with Ctotal FS under secondary forest (KgC.m-2) Evolution of Cfor in comparison with Ctotal FG under gallery forest (KgC.m-2) Distribution verticale du signal isotopique 13C dans les 3 sites. -60 -60 -80 -80 -100 -100 -80 2.00 Cfor FS 1.00 -100 -120 0.00 CforFG -120 Ctot FS Ctot FG FG FS -120 SA Ifo_suspense@yahoo.fr BP 69 Université Marien Ngouabi Faculté des Sciences Tél: (242) 068029720. Brazzaville-CONGO This research was funded by the International Foundation for Science (IFS)


