Leakage of long-period oscillations from the chromosphere to the corona , N.Chorley
advertisement

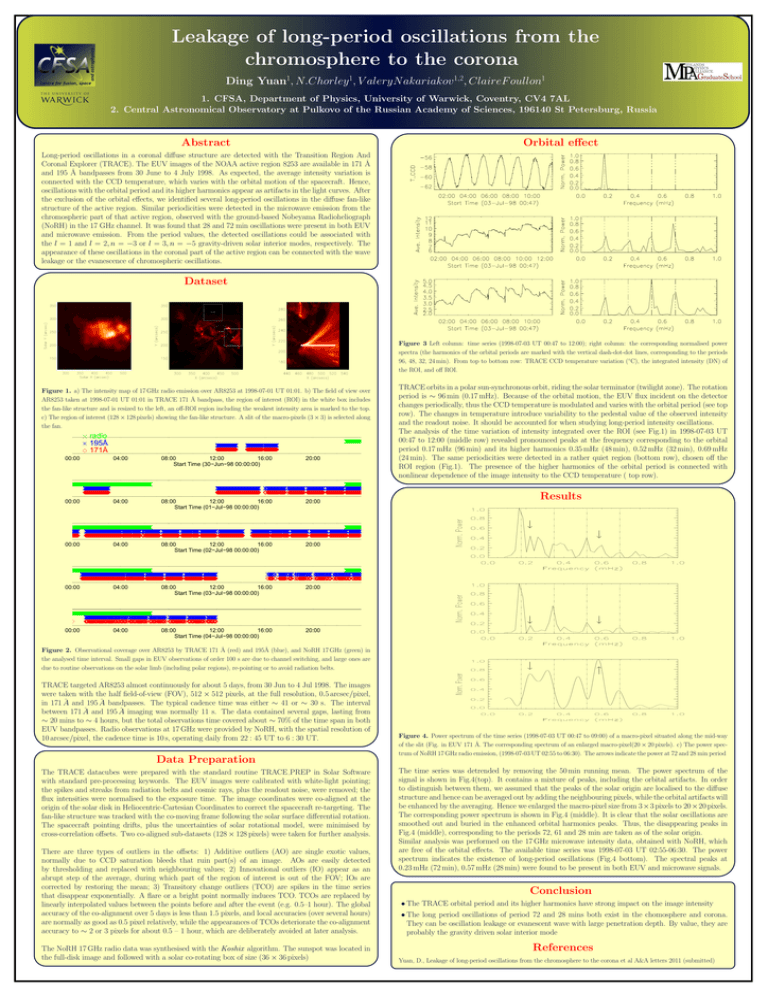
Leakage of long-period oscillations from the chromosphere to the corona Ding Yuan1, N.Chorley 1, V aleryN akariakov 1,2, ClaireF oullon1 1. CFSA, Department of Physics, University of Warwick, Coventry, CV4 7AL 2. Central Astronomical Observatory at Pulkovo of the Russian Academy of Sciences, 196140 St Petersburg, Russia Abstract Orbital effect Long-period oscillations in a coronal diffuse structure are detected with the Transition Region And Coronal Explorer (TRACE). The EUV images of the NOAA active region 8253 are available in 171 Å and 195 Å bandpasses from 30 June to 4 July 1998. As expected, the average intensity variation is connected with the CCD temperature, which varies with the orbital motion of the spacecraft. Hence, oscillations with the orbital period and its higher harmonics appear as artifacts in the light curves. After the exclusion of the orbital effects, we identified several long-period oscillations in the diffuse fan-like structure of the active region. Similar periodicities were detected in the microwave emission from the chromospheric part of that active region, observed with the ground-based Nobeyama Radioheliograph (NoRH) in the 17 GHz channel. It was found that 28 and 72 min oscillations were present in both EUV and microwave emission. From the period values, the detected oscillations could be associated with the l = 1 and l = 2, n = −3 or l = 3, n = −5 gravity-driven solar interior modes, respectively. The appearance of these oscillations in the coronal part of the active region can be connected with the wave leakage or the evanescence of chromospheric oscillations. Dataset Figure 3 Left column: time series (1998-07-03 UT 00:47 to 12:00); right column: the corresponding normalised power spectra (the harmonics of the orbital periods are marked with the vertical dash-dot-dot lines, corresponding to the periods 96, 48, 32, 24 min). From top to bottom row: TRACE CCD temperature variation (◦C), the integrated intensity (DN) of the ROI, and off ROI. Figure 1. a) The intensity map of 17 GHz radio emission over AR8253 at 1998-07-01 UT 01:01. b) The field of view over AR8253 taken at 1998-07-01 UT 01:01 in TRACE 171 Å bandpass, the region of interest (ROI) in the white box includes the fan-like structure and is resized to the left, an off-ROI region including the weakest intensity area is marked to the top. c) The region of interest (128 × 128 pixels) showing the fan-like structure. A slit of the macro-pixels (3 × 3) is selected along the fan. radio 195Å 171Å 00:00 04:00 08:00 12:00 16:00 Start Time (30−Jun−98 00:00:00) 20:00 00:00 04:00 08:00 12:00 16:00 Start Time (01−Jul−98 00:00:00) 20:00 00:00 04:00 08:00 12:00 16:00 Start Time (02−Jul−98 00:00:00) 20:00 00:00 04:00 08:00 12:00 16:00 Start Time (03−Jul−98 00:00:00) 20:00 00:00 04:00 08:00 12:00 16:00 Start Time (04−Jul−98 00:00:00) 20:00 TRACE orbits in a polar sun-synchronous orbit, riding the solar terminator (twilight zone). The rotation period is ∼ 96 min (0.17 mHz). Because of the orbital motion, the EUV flux incident on the detector changes periodically, thus the CCD temperature is modulated and varies with the orbital period (see top row). The changes in temperature introduce variability to the pedestal value of the observed intensity and the readout noise. It should be accounted for when studying long-period intensity oscillations. The analysis of the time variation of intensity integrated over the ROI (see Fig.1) in 1998-07-03 UT 00:47 to 12:00 (middle row) revealed pronounced peaks at the frequency corresponding to the orbital period 0.17 mHz (96 min) and its higher harmonics 0.35 mHz (48 min), 0.52 mHz (32 min), 0.69 mHz (24 min). The same periodicities were detected in a rather quiet region (bottom row), chosen off the ROI region (Fig.1). The presence of the higher harmonics of the orbital period is connected with nonlinear dependence of the image intensity to the CCD temperature ( top row). Results Figure 2. Observational coverage over AR8253 by TRACE 171 Å (red) and 195Å (blue), and NoRH 17 GHz (green) in the analysed time interval. Small gaps in EUV observations of order 100 s are due to channel switching, and large ones are due to routine observations on the solar limb (including polar regions), re-pointing or to avoid radiation belts. TRACE targeted AR8253 almost continuously for about 5 days, from 30 Jun to 4 Jul 1998. The images were taken with the half field-of-view (FOV), 512 × 512 pixels, at the full resolution, 0.5 arcsec/pixel, in 171 Å and 195 Å bandpasses. The typical cadence time was either ∼ 41 or ∼ 30 s. The interval between 171 Å and 195 Å imaging was normally 11 s. The data contained several gaps, lasting from ∼ 20 mins to ∼ 4 hours, but the total observations time covered about ∼ 70% of the time span in both EUV bandpasses. Radio observations at 17 GHz were provided by NoRH, with the spatial resolution of 10 arcsec/pixel, the cadence time is 10 s, operating daily from 22 : 45 UT to 6 : 30 UT. Data Preparation The TRACE datacubes were prepared with the standard routine TRACE PREP in Solar Software with standard pre-processing keywords. The EUV images were calibrated with white-light pointing; the spikes and streaks from radiation belts and cosmic rays, plus the readout noise, were removed; the flux intensities were normalised to the exposure time. The image coordinates were co-aligned at the origin of the solar disk in Heliocentric-Cartesian Coordinates to correct the spacecraft re-targeting. The fan-like structure was tracked with the co-moving frame following the solar surface differential rotation. The spacecraft pointing drifts, plus the uncertainties of solar rotational model, were minimised by cross-correlation offsets. Two co-aligned sub-datasets (128 × 128 pixels) were taken for further analysis. There are three types of outliers in the offsets: 1) Additive outliers (AO) are single exotic values, normally due to CCD saturation bleeds that ruin part(s) of an image. AOs are easily detected by thresholding and replaced with neighbouring values; 2) Innovational outliers (IO) appear as an abrupt step of the average, during which part of the region of interest is out of the FOV; IOs are corrected by restoring the mean; 3) Transitory change outliers (TCO) are spikes in the time series that disappear exponentially. A flare or a bright point normally induces TCO. TCOs are replaced by linearly interpolated values between the points before and after the event (e.g. 0.5–1 hour). The global accuracy of the co-alignment over 5 days is less than 1.5 pixels, and local accuracies (over several hours) are normally as good as 0.5 pixel relatively, while the appearances of TCOs deteriorate the co-alignment accuracy to ∼ 2 or 3 pixels for about 0.5 – 1 hour, which are deliberately avoided at later analysis. The NoRH 17 GHz radio data was synthesised with the Koshix algorithm. The sunspot was located in the full-disk image and followed with a solar co-rotating box of size (36 × 36 pixels) Figure 4. Power spectrum of the time series (1998-07-03 UT 00:47 to 09:00) of a macro-pixel situated along the mid-way of the slit (Fig. in EUV 171 Å. The corresponding spectrum of an enlarged macro-pixel(20 × 20 pixels). c) The power spectrum of NoRH 17 GHz radio emission, (1998-07-03 UT 02:55 to 06:30). The arrows indicate the power at 72 and 28 min period The time series was detrended by removing the 50 min running mean. The power spectrum of the signal is shown in Fig.4(top). It contains a mixture of peaks, including the orbital artifacts. In order to distinguish between them, we assumed that the peaks of the solar origin are localised to the diffuse structure and hence can be averaged out by adding the neighbouring pixels, while the orbital artifacts will be enhanced by the averaging. Hence we enlarged the macro-pixel size from 3 × 3 pixels to 20 × 20 pixels. The corresponding power spectrum is shown in Fig.4 (middle). It is clear that the solar oscillations are smoothed out and buried in the enhanced orbital harmonics peaks. Thus, the disappearing peaks in Fig.4 (middle), corresponding to the periods 72, 61 and 28 min are taken as of the solar origin. Similar analysis was performed on the 17 GHz microwave intensity data, obtained with NoRH, which are free of the orbital effects. The available time series was 1998-07-03 UT 02:55-06:30. The power spectrum indicates the existence of long-period oscillations (Fig.4 bottom). The spectral peaks at 0.23 mHz (72 min), 0.57 mHz (28 min) were found to be present in both EUV and microwave signals. Conclusion • The TRACE orbital period and its higher harmonics have strong impact on the image intensity • The long period oscillations of period 72 and 28 mins both exist in the chomosphere and corona. They can be oscillation leakage or evanescent wave with large penetration depth. By value, they are probably the gravity driven solar interior mode References Yuan, D., Leakage of long-period oscillations from the chromosphere to the corona et al A&A letters 2011 (submitted)


![Donald R. McMullin [], Space Systems Research Corporation,](http://s2.studylib.net/store/data/013086518_1-95e919d6d2cc7e29b794a77fcde0f04b-300x300.png)