Measurement of impulsive choice in rats: II. Test-retest reliability
advertisement
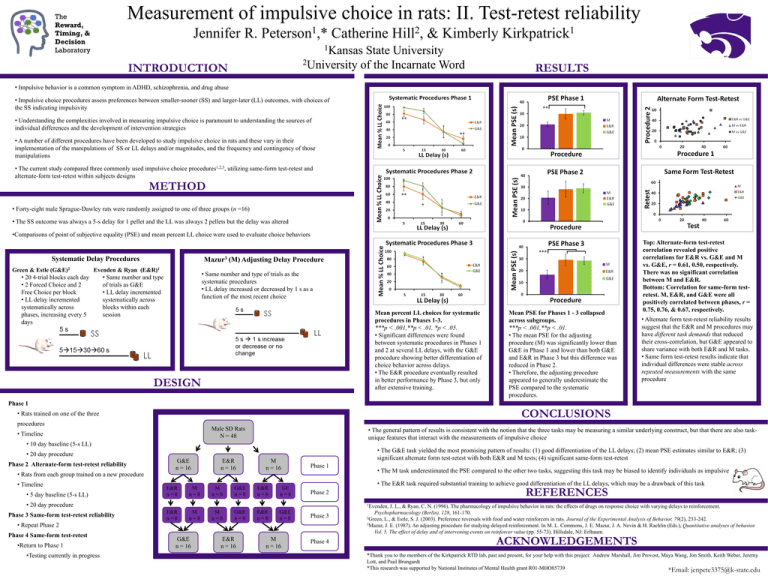
Measurement of impulsive choice in rats: II. Test-retest reliability Jennifer R. 1 Peterson ,* Catherine 2 Hill , & Kimberly 1 Kirkpatrick 1Kansas State University 2University of the Incarnate Word INTRODUCTION RESULTS • Impulsive behavior is a common symptom in ADHD, schizophrenia, and drug abuse • Impulsive choice procedures assess preferences between smaller-sooner (SS) and larger-later (LL) outcomes, with choices of the SS indicating impulsivity ** • Understanding the complexities involved in measuring impulsive choice is paramount to understanding the sources of individual differences and the development of intervention strategies ** ** • A number of different procedures have been developed to study impulsive choice in rats and these vary in their implementation of the manipulations of SS or LL delays and/or magnitudes, and the frequency and contingency of those manipulations • The current study compared three commonly used impulsive choice procedures1,2,3, utilizing same-form test-retest and alternate-form test-retest within subjects designs METHOD ** * • Forty-eight male Sprague-Dawley rats were randomly assigned to one of three groups (n =16) • The SS outcome was always a 5-s delay for 1 pellet and the LL was always 2 pellets but the delay was altered •Comparisons of point of subjective equality (PSE) and mean percent LL choice were used to evaluate choice behaviors *** Systematic Delay Procedures Mazur3 (M) Adjusting Delay Procedure Green & Estle (G&E)2 Evenden & Ryan (E&R)1 • 20 4-trial blocks each day • Same number and type • 2 Forced Choice and 2 of trials as G&E Free Choice per block • LL delay incremented • LL delay incremented systematically across systematically across blocks within each phases, increasing every 5 session days • Same number and type of trials as the systematic procedures • LL delay increased or decreased by 1 s as a function of the most recent choice Mean percent LL choices for systematic procedures in Phases 1-3. ***p < .001,**p < .01, *p < .05. • Significant differences were found between systematic procedures in Phases 1 and 2 at several LL delays, with the G&E procedure showing better differentiation of choice behavior across delays. • The E&R procedure eventually resulted in better performance by Phase 3, but only after extensive training. DESIGN Mean PSE for Phases 1 - 3 collapsed across subgroups. ***p < .001,**p < .01. • The mean PSE for the adjusting procedure (M) was significantly lower than G&E in Phase 1 and lower than both G&E and E&R in Phase 3 but this difference was reduced in Phase 2. • Therefore, the adjusting procedure appeared to generally underestimate the PSE compared to the systematic procedures. Top: Alternate-form test-retest correlation revealed positive correlations for E&R vs. G&E and M vs. G&E, r = 0.61, 0.50, respectively. There was no significant correlation between M and E&R. Bottom: Correlation for same-form testretest. M, E&R, and G&E were all positively correlated between phases, r = 0.75, 0.76, & 0.67, respectively. • Alternate form test-retest reliability results suggest that the E&R and M procedures may have different task demands that reduced their cross-correlation, but G&E appeared to share variance with both E&R and M tasks. • Same form test-retest results indicate that individual differences were stable across repeated measurements with the same procedure Phase 1 CONCLUSIONS • Rats trained on one of the three procedures Male SD Rats N = 48 • Timeline • The general pattern of results is consistent with the notion that the three tasks may be measuring a similar underlying construct, but that there are also taskunique features that interact with the measurements of impulsive choice • 10 day baseline (5-s LL) • The G&E task yielded the most promising pattern of results: (1) good differentiation of the LL delays; (2) mean PSE estimates similar to E&R; (3) significant alternate form test-retest with both E&R and M tests; (4) significant same-form test-retest • 20 day procedure Phase 2 Alternate-form test-retest reliability • Rats from each group trained on a new procedure • Timeline • 5 day baseline (5-s LL) G&E n = 16 E&R n=8 M n=8 E&R n = 16 M n=8 G&E n=8 M n = 16 E&R n=8 GE n=8 Phase 1 • The E&R task required substantial training to achieve good differentiation of the LL delays, which may be a drawback of this task 1Evenden, E&R n=8 M n=8 M n=8 G&E n=8 E&R n=8 G&E n=8 Phase 3 • Repeat Phase 2 Phase 4 Same-form test-retest •Return to Phase 1 •Testing currently in progress REFERENCES Phase 2 • 20 day procedure Phase 3 Same-form test-retest reliability • The M task underestimated the PSE compared to the other two tasks, suggesting this task may be biased to identify individuals as impulsive G&E n = 16 E&R n = 16 M n = 16 Phase 4 J. L., & Ryan, C. N. (1996). The pharmacology of impulsive behavior in rats: the effects of drugs on response choice with varying delays to reinforcement. Psychopharmacology (Berlin), 128, 161-170. 2Green, L., & Estle, S. J. (2003). Preference reversals with food and water reinforcers in rats. Journal of the Experimental Analysis of Behavior, 79(2), 233-242. 3Mazur, J. E. (1987). An adjusting procedure for studying delayed reinforcement. In M. L. Commons, J. E. Mazur, J. A. Nevin & H. Rachlin (Eds.), Quantitative analyses of behavior. Vol. 5. The effect of delay and of intervening events on reinforcer value (pp. 55-73). Hillsdale, NJ: Erlbaum. ACKNOWLEDGEMENTS *Thank you to the members of the Kirkpatrick RTD lab, past and present, for your help with this project: Andrew Marshall, Jim Provost, Maya Wang, Jon Smith, Keith Weber, Jeremy Lott, and Paul Brungardt *This research was supported by National Institutes of Mental Health grant R01-MHO85739 *Email: jenpete3375@k-state.edu
