Men Women Undergraduate Degree-Seeking Students Women 1221
advertisement
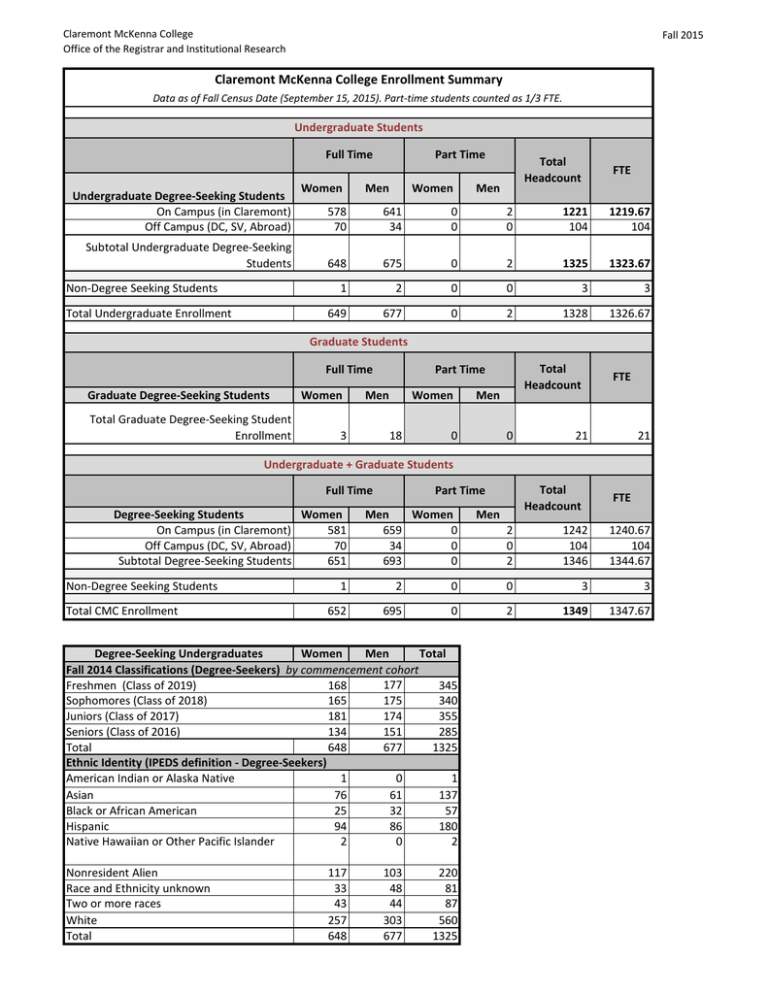
Claremont McKenna College Office of the Registrar and Institutional Research Fall 2015 Claremont McKenna College Enrollment Summary Data as of Fall Census Date (September 15, 2015). Part-time students counted as 1/3 FTE. Undergraduate Students Full Time Undergraduate Degree-Seeking Students On Campus (in Claremont) Off Campus (DC, SV, Abroad) Subtotal Undergraduate Degree-Seeking Students Non-Degree Seeking Students Total Undergraduate Enrollment Women Part Time Men Women Total Headcount Men FTE 578 70 641 34 0 0 2 0 1221 104 1219.67 104 648 675 0 2 1325 1323.67 1 2 0 0 3 3 649 677 0 2 1328 1326.67 Graduate Students Full Time Graduate Degree-Seeking Students Total Graduate Degree-Seeking Student Enrollment Women Men 3 Total Headcount Part Time Women 18 Men 0 0 FTE 21 21 Undergraduate + Graduate Students Full Time Degree-Seeking Students Women On Campus (in Claremont) 581 Off Campus (DC, SV, Abroad) 70 Subtotal Degree-Seeking Students 651 Non-Degree Seeking Students Total CMC Enrollment Men Women 0 659 34 0 693 0 Men FTE 2 0 2 1242 104 1346 1240.67 104 1344.67 1 2 0 0 3 3 652 695 0 2 1349 1347.67 Degree-Seeking Undergraduates Women Men Total Fall 2014 Classifications (Degree-Seekers) by commencement cohort 177 Freshmen (Class of 2019) 168 345 165 175 340 Sophomores (Class of 2018) Juniors (Class of 2017) 181 174 355 Seniors (Class of 2016) 134 151 285 Total 648 677 1325 Ethnic Identity (IPEDS definition - Degree-Seekers) 1 0 1 American Indian or Alaska Native Asian 76 61 137 Black or African American 25 32 57 Hispanic 94 86 180 Native Hawaiian or Other Pacific Islander 2 0 2 Nonresident Alien Race and Ethnicity unknown Two or more races White Total Total Headcount Part Time 117 33 43 257 648 103 48 44 303 677 220 81 87 560 1325 Claremont McKenna College Office of the Registrar and Institutional Research Fall 2015 Geographic Distribution of Permanent Addresses (including students on OCS) States Southern CA Central CA of students 310 11 Foreign Countries (Non-US) of students BERMUDA 1 BRAZIL 4 13 Northern CA 180 CANADA CA Total 501 CHILE 1 AK 3 CHINA 90 AL 6 ECUADOR 2 AR 1 FINLAND 2 AZ 25 FRANCE 1 CO 32 GERMANY 1 CT 21 GREECE 1 DC 5 HONG KONG DE 2 INDIA FL 7 INDONESIA 5 GA 6 ISRAEL 1 HI 12 JAPAN 3 IA 4 JORDAN 1 ID 4 KUWAIT 1 IL 48 MEXICO 5 KS 2 MOZAMBIQUE 1 KY 2 MYANMAR 2 LA 4 NORWAY 1 MA 22 PAKISTAN 3 MD 10 PHILIPPINES 6 8 40 ME 3 REPUBLIC OF KOREA MI 5 SAUDI ARABIA MN 12 MO 7 SPAIN 1 MS 1 SRI LANKA 1 MT 3 SWITZERLAND 2 NC 3 TAIWAN 3 NH 3 THAILAND 3 NJ 18 UNITED ARAB EMIRATES 7 NM 7 UNITED KINGDOM 5 NV 8 VIETNAM 2 NY 50 OH 14 OR 40 PA 11 RI 1 TN 8 TX 38 UT 7 VA 18 VT 1 WA 102 WI 4 WY 1 Total Students US Permanent Address 1082 # Unique States & Territories (including CA) 44 SINGAPORE Total Students Non-US Country Permanent Address # Unique Foreign Countries (not including US) 11 1 14 243 34 Total # Unique Students Represented in Permanent Address Charts = 1326 (total undergraduate degreeseekers)
