Document 13219762
advertisement
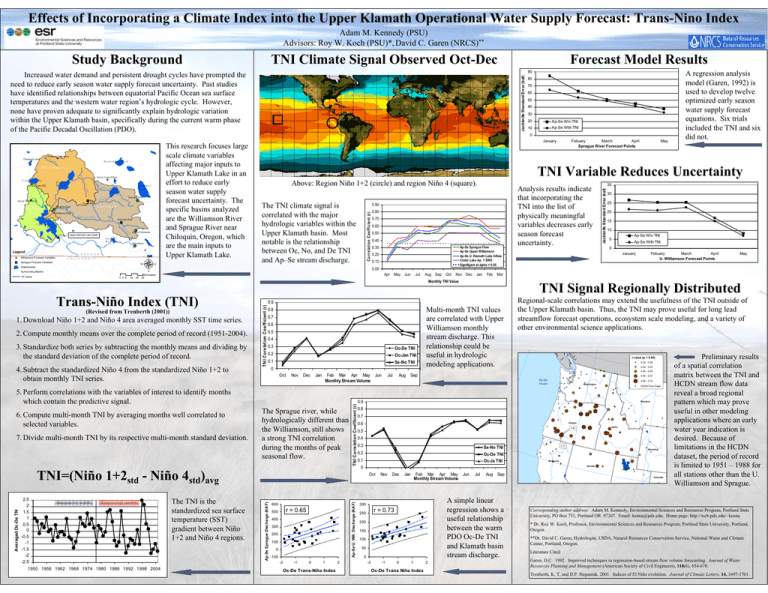
Effects of Incorporating a Climate Index into the Upper Klamath Operational Water Supply Forecast: Trans-Nino Index Adam M. Kennedy (PSU) Advisors: Roy W. Koch (PSU)*, David C. Garen (NRCS)** Study Background TNI Climate Signal Observed Oct-Dec Forecast Model Results 90 Jackknife Standard Error (kaf) Increased water demand and persistent drought cycles have prompted the need to reduce early season water supply forecast uncertainty. Past studies have identified relationships between equatorial Pacific Ocean sea surface temperatures and the western water region’s hydrologic cycle. However, none have proven adequate to significantly explain hydrologic variation within the Upper Klamath basin, specifically during the current warm phase of the Pacific Decadal Oscillation (PDO). 80 70 60 50 40 30 20 Ap-Se W/o TNI Ap-Se With TNI 10 0 January ER C Paulina Marsh R W Silver Creek Pillow il a li Crater Lake i n R mso Klamath Marsh Crater Lake HQ Long Creek Summer Lake Sycan Marsh Summer Rim S r r ve Seven Mile Marsh v y ca n R i e Taylor Butte U p p e r K l a m a t h L a k e S p r a g u e Sprague Gage Williamson Gage Sp r a g u e Ri v e r Klamath Well Upper Klamath Lake F ish ho eC l e ek r # Upper Klamath Lake Outlet Gerber Reservoir er Strawberry R iv LO S T R Quartz Mountain Legend K la m a th µ O R E G O N Williamson Forecast Variables C A L I F O R N I A Sprague Forecast Variables Waterbodies Surrounding Basins "A" Canal 0 4 8 16 24 TNI Variable Reduces Uncertainty Above: Region Niño 1+2 (circle) and region Niño 4 (square). The TNI climate signal is correlated with the major hydrologic variables within the Upper Klamath basin. Most notable is the relationship between Oc, No, and De TNI and Ap–Se stream discharge. 0.90 0.80 0.70 0.60 0.50 0.40 0.30 Ap-Se Sprague Flow Ap-Se Upper Williamson Ap-Se U. Klamath Lake Inflow Crater Lake Ap. 1 SWE Signifigant at alpha = 0.05 0.20 0.10 Apr May Jun Jul 0.7 0.6 0.5 0.4 0.3 Oc-De TNI 0.2 Oc-Jan TNI 0.1 Se-No TNI 4. Subtract the standardized Niño 4 from the standardized Niño 1+2 to obtain monthly TNI series. 0 15 10 Ap-Se W/o TNI 5 Ap-Se With TNI 0 Febuary March April U. Williamson Forecast Points Aug Sep Oct Nov Dec Jan Feb May Mar 6. Compute multi-month TNI by averaging months well correlated to selected variables. 7. Divide multi-month TNI by its respective multi-month standard deviation. Nov Dec Jan Feb Mar Apr May Monthly Stream Volume Multi-month TNI values are correlated with Upper Williamson monthly stream discharge. This relationship could be useful in hydrologic modeling applications. -130° -120° -110° r-value (p < 0.05) 0.32 - 0.38 0.39 - 0.43 Jun Jul Aug Sep 0.50 - 0.57 Pacific Ocean 0.58 - 0.73 Washington HCDN Flow Gage 0.9 The Sprague river, while hydrologically different than the Williamson, still shows a strong TNI correlation during the months of peak seasonal flow. Montana 0.8 0.7 0.6 Oregon 0.4 0.3 Se-No TNI 0.2 Oc-De TNI 0.1 Oc-Ja TNI 0.73 Wyoming California Nevada 0 Utah Oct Nov Dec Jan Feb Mar Apr May Monthly Stream Volume Jun Jul Aug Sep Colorado Ap-Se U. Will. Discharge (KAF) Ap-Se Sprague Discharge (KAF) -120° 600 r = 0.65 500 400 300 200 100 0 -100 -2 -1 0 1 Oc-De Trans-Niño Index 2 Idaho 0.68 0.5 TNI=(Niño 1+2std - Niño 4std)avg The TNI is the standardized sea surface temperature (SST) gradient between Niño 1+2 and Niño 4 regions. TNI Signal Regionally Distributed Regional-scale correlations may extend the usefulness of the TNI outside of the Upper Klamath basin. Thus, the TNI may prove useful for long lead streamflow forecast operations, ecosystem scale modeling, and a variety of other environmental science applications. 0.44 - 0.49 Oct 5. Perform correlations with the variables of interest to identify months which contain the predictive signal. Averaged Oc-De TNI 20 40° 3. Standardize both series by subtracting the monthly means and dividing by the standard deviation of the complete period of record. 0.8 TNI Correlation Coefficient (r) 2. Compute monthly means over the complete period of record (1951-2004). 1950 1956 1962 1968 1974 1980 1986 1992 1998 2004 25 January 0.9 TNI Corelation Coefficient (r) (Revised from Trenberth (2001)) 1. Download Niño 1+2 and Niño 4 area averaged monthly SST time series. Homogenous high variability 30 0.00 Kilometers 32 Trans-Niño Index (TNI) Homogenous low variability 35 Analysis results indicate that incorporating the TNI into the list of physically meaningful variables decreases early season forecast uncertainty. Monthly TNI Value 2.5 2 1.5 1 0.5 0 -0.5 -1 -1.5 -2 -2.5 May 50° I LL Febuary March April Sprague River Forecast Points Jackknife Standard Error (kaf) M W i l l i a m s o n C orrelation C oefficient (r) Chemault Alternative Diamond Lake This research focuses large scale climate variables affecting major inputs to Upper Klamath Lake in an effort to reduce early season water supply forecast uncertainty. The specific basins analyzed are the Williamson River and Sprague River near Chiloquin, Oregon, which are the main inputs to Upper Klamath Lake. A regression analysis model (Garen, 1992) is used to develop twelve optimized early season water supply forecast equations. Six trials included the TNI and six did not. A simple linear regression shows a useful relationship between the warm PDO Oc-De TNI and Klamath basin stream discharge. 300 r = 0.73 250 200 150 100 50 0 -2 -1 0 1 Oc-De Trans Niño Index 2 -110° Preliminary results of a spatial correlation matrix between the TNI and HCDN stream flow data reveal a broad regional pattern which may prove useful in other modeling applications where an early water year indication is desired. Because of limitations in the HCDN dataset, the period of record is limited to 1951 – 1988 for all stations other than the U. Williamson and Sprague. Corresponding author address: Adam M. Kennedy, Environmental Sciences and Resources Program, Portland State University, PO Box 751, Portland OR. 97207. Email: kenna@pdx.edu. Home page: http://web.pdx.edu/~kenna * Dr. Roy W. Koch, Professor, Environmental Sciences and Resources Program, Portland State University, Portland, Oregon. **Dr. David C. Garen, Hydrologist, USDA, Natural Resources Conservation Service, National Water and Climate Center, Portland, Oregon. Literature Cited: Garen, D.C. 1992. Improved techniques in regression-based stream flow volume forecasting. Journal of Water Resources Planning and Management (American Society of Civil Engineers), 118(6), 654-670. Trenberth, K. T, and D.P. Stepaniak. 2001. Indices of El Niño evolution. Journal of Climate Letters, 14, 1697-1701.
