A Heuristic Map of Lean and Safety Engineering Methodologies The Background 11/22/2009
advertisement
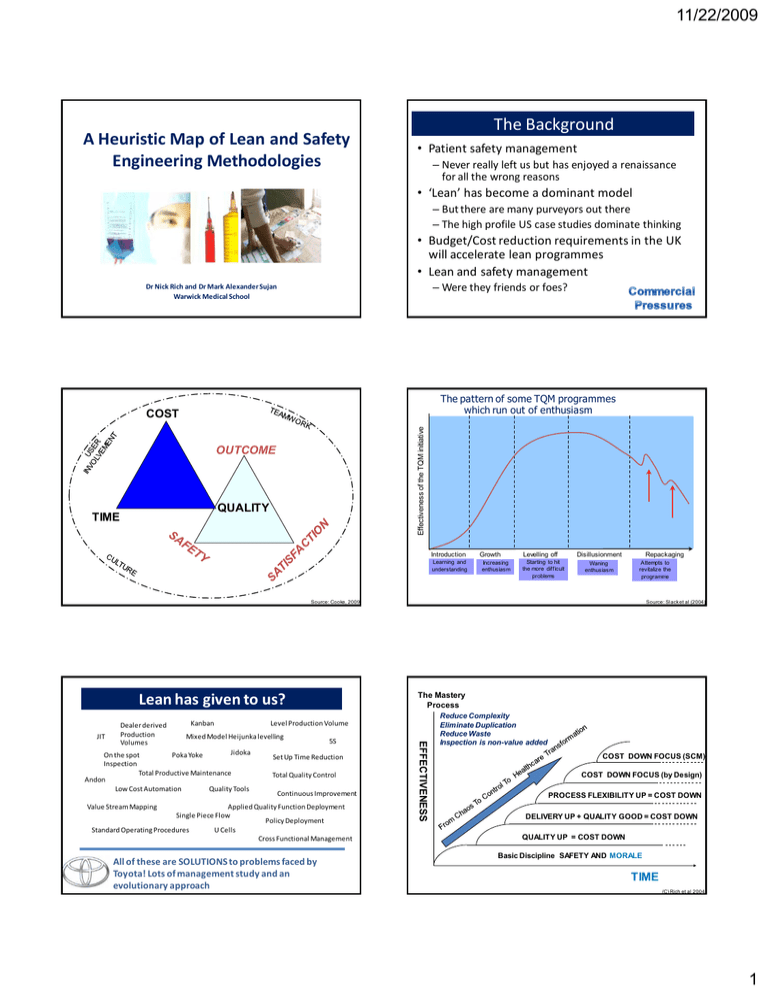
11/22/2009 A Heuristic Map of Lean and Safety Engineering Methodologies The Background • Patient safety management – Never really left us but has enjoyed a renaissance for all the wrong reasons • ‘Lean’ has become a dominant model – But there are many purveyors out there – The high profile US case studies dominate thinking • Budget/Cost reduction requirements in the UK will accelerate lean programmes • Lean and safety management – Were they friends or foes? Dr Nick Rich and Dr Mark Alexander Sujan Warwick Medical School The pattern of some TQM programmes which run out of enthusiasm Effectiveness of the TQM initiative COST OUTCOME QUALITY TIME Introduction Learning and understanding Growth Increasing enthusiasm Levelling off Starting to hit the more difficult problems Disillusionment Waning enthusiasm Source: Slack etetalal(2004) Source: Slack (2004) Source: Cooke, 2009 The Mastery Process Lean has given to us? JIT Kanban Level Production Volume Mixed Model Heijunka levelling Jidoka On the spot Poka Yoke Inspection Total Productive Maintenance Andon Low Cost Automation Quality Tools 5S Set Up Time Reduction Total Quality Control Continuous Improvement Value Stream Mapping Applied Quality Function Deployment Single Piece Flow Policy Deployment Standard Operating Procedures U Cells Cross Functional Management All of these are SOLUTIONS to problems faced by Toyota! Lots of management study and an evolutionary approach EFFECTIVENESS Dealer derived Production Volumes Repackaging Attempts to revitalize the programme Reduce Complexity Eliminate Duplication Reduce Waste Inspection is non-value added COST DOWN FOCUS (SCM) COST DOWN FOCUS (by Design) PROCESS FLEXIBILITY UP = COST DOWN DELIVERY UP + QUALITY GOOD = COST DOWN QUALITY UP = COST DOWN Basic Discipline SAFETY AND MORALE TIME (C) Rich et al 2004 1 11/22/2009 A Single Organisational System - Consensus- QUALITY DELIVERY Total Quality Management Practices and Problem Solving by Teams Toyota Production System And standardised work Approach to flow Total Quality Management Approach Six Sigma Statistical Process Control Design of Experiments Taguchi Methods Quality Focus Problem-Solving Lean Production System Design Level Production Supplier Pull Systems Cells & Layout Quick Changeover Standardised Work Mistake Proofing Brainstorming Cause and Effect Pareto Workplace Organisation CANDO/5S Visual Management Teams Mistake Proofing Mistake Proofing Problem-Solving Problem-Solving Delivery Focus Autonomous Maintenance Planned Maintenance Quality Maintenance OEE Analysis Early Equipment Management Reliability Centred Maintenance Total Productive Maintenance And an approach to system Reliability for interrupted flow Total Productive Maintenance Approach RELIABILITY © Nick Rich 2000 Lean will address Lapses Cost Focus Lean has also helped improve micro-systems Thought there was too much paperwork to complete to report an incident – so didn’t Taken a short cut Poor Handovers Had a near-miss Followed ‘Out of Date’ Procedures Did not gel your hands Saw something and felt you should have spoken up – but did not Improvements Source: NHSi The Challenge 2 11/22/2009 Systems Safety (Reason, 1990) Two Approaches Individual Approach • Person is at fault • Apportion blame • Punish and remove the individual System Approach • Failure is hidden in the system of healthcare and awaits the opportunity to happen • Not an individual failure • Systems must be changed and improved to manage safely Some holes due to active failures Hazards Other holes due to Victims latent ‘pathogens’ Successive layers of defences, barriers, & safeguards Source: Reason, 1990 The safety world enjoys creating barriers, duplication and redundancy Organisational Factors The System Culture Defences Mitigation Resilience What the Patient Sees And Experiences Practice Defences Mitigation Resilience Politics Defences Mitigation Resilience Intervention INPUT OUTPUT Task Care Errors Risks Errors Risks Errors Errors Errors Risks ErrorsRisks Risks Errors Risks Errors Environment The different Safety levels Business Effectiveness & Results Value & Growth Focus Full Potential Lean and Safety are not necessarily at odds. Past History (Memory) Training Equipment Source: Jones, 2009 Levels of Analysis Team Working and Learning Groups Cognitive – Multi-Disciplinary Team (Pathway Safety) Glass Ceiling Stall Point Neither can survive effectively in isolation Cognitive – Decision Making and situation Awareness Safety Focus ? People Clarity of Roles Clinical Status and Handovers (Standardised Work and Information) Lean Operational Excellence Decline Capability Establishing Roles and Responsibilities Physical Improvement (Workplace, Materials and Equipment) To Care 3 11/22/2009 SAFETY SAFETY 4 RESIST RESIST 3 LEARN LEARN 4 IN THIS ZONE YOU ARE Spending Effort on SAFETY MANGEMENT but low efficiency gain (safe but slow) 2 2 SOLVE SOLVE 1 IN THIS ZONE YOU ARE Spending Effort on speeding patient FLOW but systems at risk of patient harm (Fast but Fragile) 1 ANALYZE ANALYZE IMPROVE PERFECT ANALYZE STABLE IMPROVE PERFECT LEAN STABLE LEAN ANALYZE 3 Methods Stage One STAGE ONE Theme SAFETY System Risk Assessment and visualisation LEAN Awareness of Value and visualisation Focus Understanding of the system (risks) and the buy in of key stakeholders via participation. Main Issues Tools Risks System Models, process maps, task analysis Prioritisation Tool Measures FMEA Risk Scores and quantified levels of risk (historic data or expert/manufacturer) Understanding of the system (wastes) and the buy in of key stakeholders Costs, duplication, and delays Pareto of patient types (families), flow and cycle times, quality, hours of operation. Quick Fixes Basic P/solving Value added time, distance, Number of incidents Typical Stakeholders Involved in this stage Clinical experts and human factors/safety experts with management input Improvement specialist supported by clinical, safety, and management representatives Education for the clinical stakeholders Reflection Low – active through learning by doing (building the map) Current state map - Low because it focuses on immediate issues. Novelty through thinking about human factors and taking a systematic approach to safety. Low – active through learning by doing (building the map) Current state map - Low because it focuses on immediate issues but novelty is in ‘seeing the whole’ system Stage Two FMEA Template Part/Product Name and No.: Process Owner: Process Name: Part/ Process Prepared By: FMEA Date (Orig): Failure Mode Causes Sev Occ Det RPN Audits Controls Actions (Rev.) Plans Ow ner and Timing Severity x Occurrence x Detection = Risk Priority Number STAGE ONE Theme SAFETY Solve Issues LEAN Stabilise Focus Identify and eliminate risks Standardised work/Std documents Organised environment Main Issues Risks Incident data Tools Interventions in the microsystem SBAR Prioritisation Tool Measures FMEA Number of incidents and reports Process standards – Visual Management - 5 Whys Quality of Solutions Interventions in the microsystem. Rapid Improvement Events Learning how to do it right Problem-Solving – flow barriers Number of events and incidents Normality vs abnormality Typical Stakeholders Involved in this stage Clinical experts and human factors/safety experts and teams involved with process Teams clinical, safety, and management representatives Education for the clinical stakeholders Reflection High – Solutions Management High - learning by doing PDCA KPIs and human factors. Incident Review Standard work and PDCA cycle Incident review 23 4 11/22/2009 Stage Three Documentation Project What Data is Sent Document Sender-Receiver Chart Stage Four SAFETY Resist LEAN Perfect Focus Creating reliability and systems that. Understanding of the whole system the buy in of other depts/organisations End To End Management Design of Robust, Resilient and Redundant System Design Mistake Proofing Advanced situation awareness LEAN Improvement Focus Training and audits and the buy in of key stakeholders Main Issues Tools Risks System Models, process maps, task analysis Prioritisation Tool Measures FMEA Risk Scores and quantified levels of risk (historic data or expert/manufacturer) Costs, duplication, and delays Pareto of patient types (families), flow and cycle times, quality, hours of operation. How to do it better Quick Fixes Basic P/solving Value added time, distance, Number of incidents Typical Stakeholders Involved in this stage Clinical experts and human factors/safety experts with management input Improvement specialist supported by clinical, safety, and management representatives Education for the clinical stakeholders Reflection Low – active through learning by doing (building the map) Current state map - Low because it focuses on immediate issues. Novelty through thinking about human factors and taking a systematic approach to safety. Low – active through learning by doing (building the map) Current state map - Low because it focuses on immediate issues but novelty is in ‘seeing the whole’ system DETECTED GP Hospital Ambulance Service Nursing Home District Nurse Hospital Med history Prioritisation Tool Measures P/solve embedded/IR1 End to End Maps - Kaizen Create and detect Mistake Proofing Learning how to learn and do things differently Embedded P/Solve Mean Time Between Failure Mean Time to Recover Mean time between failure Mean Time to Recover (design) Typical Stakeholders Involved in this stage All – proactive risk monitoring Many Intermediate Care Education for the clinical stakeholders Reflection Group Learning and discourse Group Learning and discourse Social Services Systematic Design for safety./Preventive/Predictive Reliability centred management Design for safety and improved flow Reliability Centred Management 4 Delays TTOs Handovers No-one to Receive Nursing Home District Nurse Other THE RESTORE CYCLE Map System Develop BestFocussed Practice Improvement Define OEE 1 Assess Criticality Potential Review Awareness of Value Visualisation Stable Improve Perfect Buy In- Loss and Standards Controls Problem Solve Economy MDT Effectiveness Design P/S tools End2End LEAN Tools THE INNOVATE CYCLE Collect Equipment Formalise Best Practices cost Focus Process & Value Stream Mapping Other Improper Referrals Ambulance Service THE VISUALISE CYCLE 2 Focus Other Practically - Making It Happen 3 Focus Social Services Other SAFETY Tools Intmdte Care No History GP CREATE Tools SAFETY Learning Create & Detect Chart STAGE ONE Theme Main Issues STAGE ONE Theme Assess the 6 Losses & Set Improvement Define Potential Priorities Appraise Condition/ Set Standards/ Restore Problem Prevention FEEDBACK 5 11/22/2009 The Current State Questions? • Building the model and testing with our partners • Positioning our partners and looking at how they evolve • How did they and do they use tools, techniques and methodologies? • Can we predict the next stage? • How are system efficiency and effectiveness measures used for learning? 6

