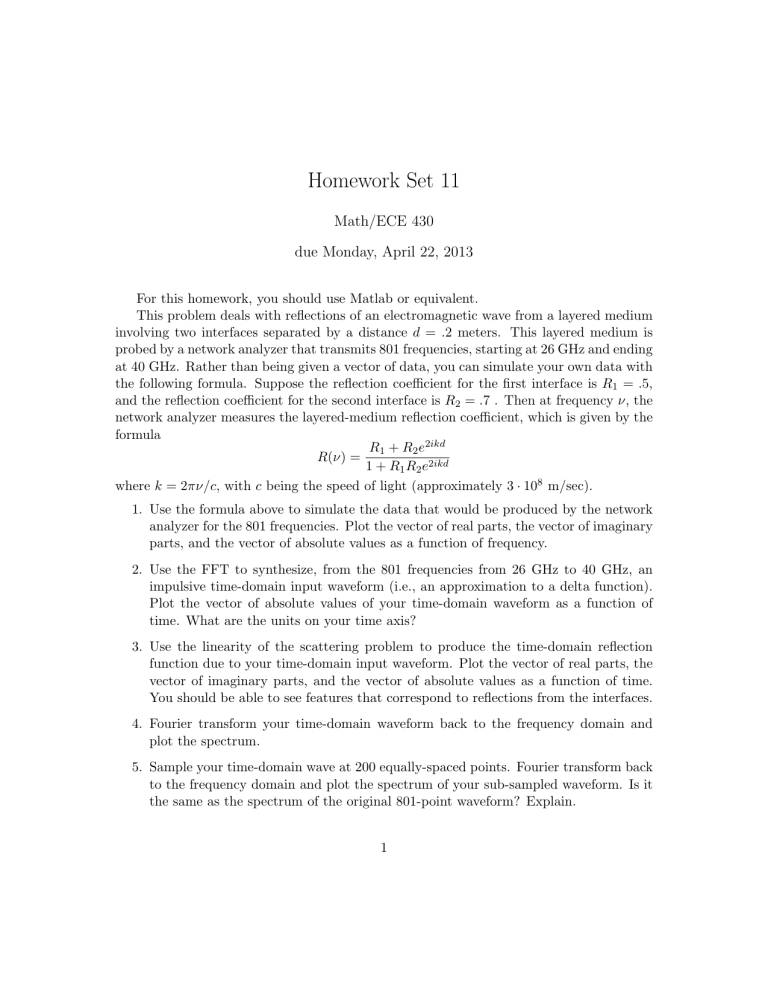
Homework Set 11 Math/ECE 430 due Monday, April 22, 2013

Homework Set 11
Math/ECE 430 due Monday, April 22, 2013
For this homework, you should use Matlab or equivalent.
This problem deals with reflections of an electromagnetic wave from a layered medium involving two interfaces separated by a distance d = .
2 meters. This layered medium is probed by a network analyzer that transmits 801 frequencies, starting at 26 GHz and ending at 40 GHz. Rather than being given a vector of data, you can simulate your own data with the following formula. Suppose the reflection coefficient for the first interface is R
1
= .
5, and the reflection coefficient for the second interface is R
2
= .
7 . Then at frequency ν , the network analyzer measures the layered-medium reflection coefficient, which is given by the formula
R ( ν ) =
R
1
+ R
2 e
2 ikd
1 + R
1
R
2 e 2 ikd where k = 2 πν/c , with c being the speed of light (approximately 3 · 10
8 m/sec).
1. Use the formula above to simulate the data that would be produced by the network analyzer for the 801 frequencies. Plot the vector of real parts, the vector of imaginary parts, and the vector of absolute values as a function of frequency.
2. Use the FFT to synthesize, from the 801 frequencies from 26 GHz to 40 GHz, an impulsive time-domain input waveform (i.e., an approximation to a delta function).
Plot the vector of absolute values of your time-domain waveform as a function of time. What are the units on your time axis?
3. Use the linearity of the scattering problem to produce the time-domain reflection function due to your time-domain input waveform. Plot the vector of real parts, the vector of imaginary parts, and the vector of absolute values as a function of time.
You should be able to see features that correspond to reflections from the interfaces.
4. Fourier transform your time-domain waveform back to the frequency domain and plot the spectrum.
5. Sample your time-domain wave at 200 equally-spaced points. Fourier transform back to the frequency domain and plot the spectrum of your sub-sampled waveform. Is it the same as the spectrum of the original 801-point waveform? Explain.
1


