Document 13161520
advertisement
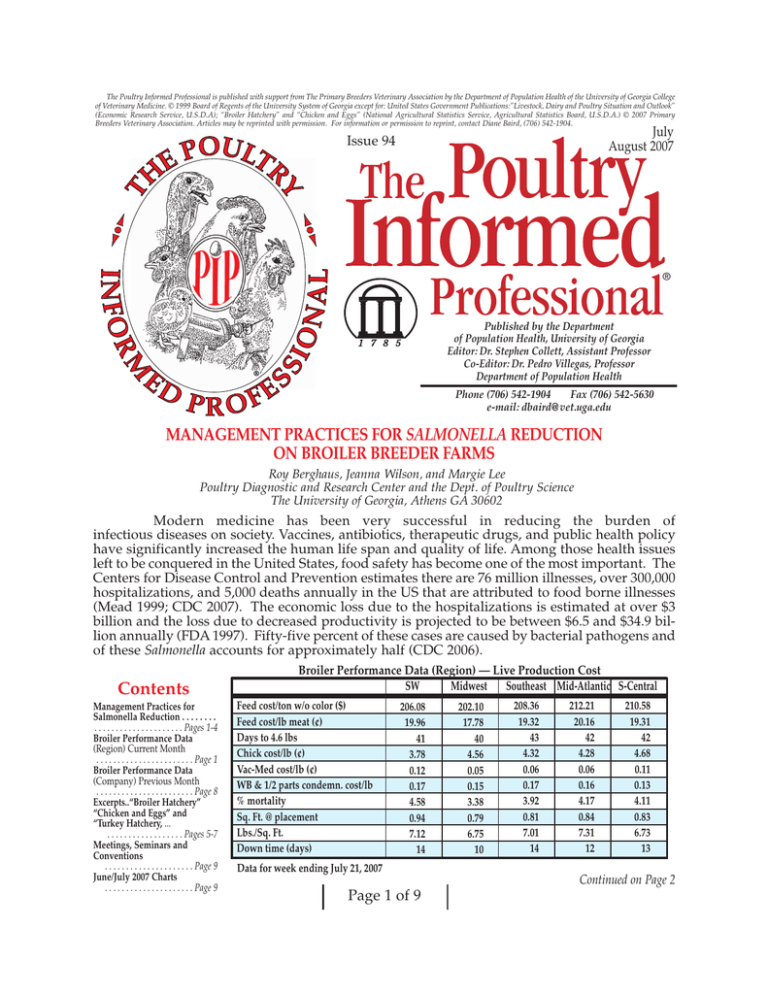
The Poultry Informed Professional is published with support from The Primary Breeders Veterinary Association by the Department of Population Health of the University of Georgia College of Veterinary Medicine. © 1999 Board of Regents of the University System of Georgia except for: United States Government Publications:”Livestock, Dairy and Poultry Situation and Outlook” (Economic Research Service, U.S.D.A); “Broiler Hatchery” and “Chicken and Eggs” (National Agricultural Statistics Service, Agricultural Statistics Board, U.S.D.A.) © 2007 Primary Breeders Veterinary Association. Articles may be reprinted with permission. For information or permission to reprint, contact Diane Baird, (706) 542-1904. July August 2007 Issue 94 ® Published by the Department of Population Health, University of Georgia Editor: Dr. Stephen Collett, Assistant Professor Co-Editor: Dr. Pedro Villegas, Professor Department of Population Health Phone (706) 542-1904 Fax (706) 542-5630 e-mail: dbaird@vet.uga.edu MANAGEMENT PRACTICES FOR SALMONELLA REDUCTION ON BROILER BREEDER FARMS Roy Berghaus, Jeanna Wilson, and Margie Lee Poultry Diagnostic and Research Center and the Dept. of Poultry Science The University of Georgia, Athens GA 30602 Modern medicine has been very successful in reducing the burden of infectious diseases on society. Vaccines, antibiotics, therapeutic drugs, and public health policy have significantly increased the human life span and quality of life. Among those health issues left to be conquered in the United States, food safety has become one of the most important. The Centers for Disease Control and Prevention estimates there are 76 million illnesses, over 300,000 hospitalizations, and 5,000 deaths annually in the US that are attributed to food borne illnesses (Mead 1999; CDC 2007). The economic loss due to the hospitalizations is estimated at over $3 billion and the loss due to decreased productivity is projected to be between $6.5 and $34.9 billion annually (FDA 1997). Fifty-five percent of these cases are caused by bacterial pathogens and of these Salmonella accounts for approximately half (CDC 2006). Contents Management Practices for Salmonella Reduction . . . . . . . . . . . . . . . . . . . . . . . . . . . . . Pages 1-4 Broiler Performance Data (Region) Current Month . . . . . . . . . . . . . . . . . . . . . . . Page 1 Broiler Performance Data (Company) Previous Month . . . . . . . . . . . . . . . . . . . . . . . Page 8 Excerpts..“Broiler Hatchery” “Chicken and Eggs” and “Turkey Hatchery, ... . . . . . . . . . . . . . . . . . . Pages 5-7 Meetings, Seminars and Conventions . . . . . . . . . . . . . . . . . . . . . Page 9 June/July 2007 Charts . . . . . . . . . . . . . . . . . . . . . Page 9 Broiler Performance Data (Region) — Live Production Cost SW Midwest Southeast Mid-Atlantic S-Central Feed cost/ton w/o color ($) Feed cost/lb meat (¢) Days to 4.6 lbs Chick cost/lb (¢) Vac-Med cost/lb (¢) WB & 1/2 parts condemn. cost/lb % mortality Sq. Ft. @ placement Lbs./Sq. Ft. Down time (days) 206.08 19.96 41 3.78 0.12 0.17 4.58 0.94 7.12 14 Data for week ending July 21, 2007 Page 1 of 9 202.10 17.78 40 4.56 0.05 0.15 3.38 0.79 6.75 10 208.36 19.32 43 4.32 0.06 0.17 3.92 0.81 7.01 14 212.21 20.16 42 4.28 0.06 0.16 4.17 0.84 7.31 12 210.58 19.31 42 4.68 0.11 0.13 4.11 0.83 6.73 13 Continued on Page 2 Poultry or poultry products account for a significant proportion of human disease (CDC 2006). In an effort to systematically reduce the levels of food borne pathogens, the Pathogen Reduction/Hazard Analysis and Critical Control Points program (HACCP) was initiated in 1998 by The Food Safety and Inspection Service (Anonymous 1998). It was successful in reducing the proportion of Salmonella-positive broiler carcasses from 20% (1995) to approximately 10% over the 6 years following its implementation but since that time, there has been an increase in Salmonella contaminated carcasses from 11.5% in 2002 to 16.3% in 2005 (FSIS 2007). Salmonella serotypes isolated from processed poultry carcasses tend to be the same as those present in the poultry farm environment (Bains, 1974; Timoney, 1970). Therefore, reducing the sources of Salmonella on broiler farms can reduce the number of contaminated carcasses in the processing plant. Many studies have demonstrated an association between environmental contamination with Salmonella and carriage of Salmonella by commercial poultry flocks. Carrier birds, eggshells, litter, dust, soil, rodents, feed, and nest boxes have all been implicated as sources (Bains, 1974; Byrd, 1999; Higgins, 1982; Lahellec, 1986; Rowe, 1980). However, many of these sources trace back to the breeder farm; therefore some of the Salmonella strains originate from the breeder flock itself. It has been known for many years that Salmonella can be transmitted vertically from broiler-breeder to broiler flocks by egg contamination, air and surface contamination in the hatching cabinet, and contaminated shipping crates (Bailey 1994; McGarr 1980; Morris 1969). Therefore, in order to further reduce carcass contamination, it may be necessary to apply control measures at multiple levels of the integrated poultry production system. Although many publications describe methods to reduce Salmonella prevalence on poultry farms, at present little is known about which of these are consistently practiced and which are effective when used in the field. We have launched a multistate study, funded by a grant from the USDA, to assess broiler-breeder management practices, make farm-specific recommendations for the reduction of Salmonella, and determine whether the changes are Page 2 of 9 effective in reducing Salmonella prevalence. The figure below illustrates the strategy we will utilize in order to accomplish the aims of this study. The identity of farms and participating companies will be kept strictly confidential. Breeder flocks in Georgia, North Carolina, Alabama, and Arkansas will be surveyed. The initial efforts will focus on identifying companies and farms to participate in the study. Once these collaborations are established, the farms will be visited by extension specialists who will assist breeder managers and their integrator service technicians in evaluating management practices, making recommendations to reduce farm sources of Salmonella, and collecting samples for Salmonella detection. The data will be analyzed in order to assess the effectiveness of management changes for reducing Salmonella prevalence. Once this information has been collected, we will be in a better position to aid the poultry industry in developing best management practices for Salmonella reduction and in developing a strategy for disseminating the information in a coherent and effective way. If you are interested in participating in the study, please contact the following extension specialists: Extension Specialist Jeanna Wilson, UGA Mike Wineland, NCSU Keith Bramwell, U. Ark. Ken Macklin, Auburn Phone Number 706-542-9137 919-515-5529 479-575-7036 334-844-4225 Fax Number 706-542-8260 919-515-7070 479-575-8775 334-844-2641 Page 3 of 9 Email Address jeannaw@uga.edu Mike_wineland@ncsu.edu bramwell@uark.edu macklks@auburn.edu REFERENCES Centers for Disease Control. 2007. Summary of Notifiable Diseases - United States, 2005. Morbidity and Mortality Weekly Report. 54:2-92. Centers for Disease Control. 2006. Surveillance for food borne-Disease Outbreaks —- United States, 1998-2002. Morbidity and Mortality Weekly Report. 55:1-34. Food Safety Inspection Service. 2007. Progress Report on Salmonella Testing of Raw Meat and Poultry Products, 1998–2006. www.fsis.usda.gov/Science/Progress_Rep ort_Salmonella_Testing_Tables/index.asp Mead, P. S,. L. Slutsker, V. Dietz, et al. 1999. Food-related illness and death in the United States. Emerg. Infect. Dis. 5:607-25. Food and Drug Administration, U.S. Department of Agriculture, and U.S. Environmental Protection Agency. Food Safety From Farm to Table: A National Food Safety Initiative, Report to the President, May 1997. Washington, DC: FDA, USDA, EPA, 1997. Anonymous. 1996. Pathogen reduction; hazard analysis and critical control point (HACCP) systems; final rule. Federal Reg. 61: 38805-38989. Bains, B. S., and M. A. MacKenzie. 1974. Transmission of Salmonella through an integrated poultry organization. Poult. Sci. 53:1114-1118. Timoney, J., W. R. Kelly, J. Hannah, and D. Reeves. 1970. A study of Salmonella contamination in some Dublin poultry processing plants. Vet. Rec. 87:158-161. Byrd, J. A., J. R. DeLoach, D. E. Corrier, D. J. Nisbet, and L. H. Stanker. 1999. Evaluation of Salmonella distributions from commercial broiler hatcheries and grower houses. Avian Dis. 43:39-47. Higgins, R., R. Malo, E. Rene-Roberge, and R. Gauthier. 1982. Studies on the dissemination of Salmonella in nine broiler-chicken flocks. Avian Dis. 26:26-33. Lahellec, C., P. Colin, G. Bennejean, J. Paquin, A. Guillerm, and J. C. Debois. 1986. Influence of resident Salmonella on contamination of broiler flocks. Poult. Sci. 65:2034-2039. Rowe, B., M. L. M. Hall, L. R. Ward, and J. D. H. De Sa. 1980. Epidemic spread of Salmonella hadar in England and Wales. Brit. Med. J. 280:1065-1066. Bailey, J. S., N. A. Cox, and M. E. Berrang. 1994. Hatchery acquired salmonellae in broiler chicks. Poult Sci. 73:1153-7. McGarr, C., W. R. Mitchell. H. C. Carlson, and N. A. Fish. 1980. An epidemiological study of Salmonella in broiler chicken production. Can. J. Public Health. 71:47-57. Morris, G. K., B. L. McMurray, M. M. Gatton, and J. G. Wells. 1969. A study of the dissemination of salmonellosis in a commercial broiler chicken operation. Am. J. Vet. Rec. 30:1413-1421. Page 4 of 9 Excerpts from the latest USDA National Agricultural Statistics Service (NASS) “Broiler Hatchery,” “Chicken and Eggs” and “Turkey Hatchery” Reports and Economic Research Service (ERS) “Livestock, Dairy and Poultry Situation Outlook” Broiler Eggs Set in 19 Selected States Up 2 Percent According to the latest National Agricultural Statistics Service (NASS) reports, commercial hatcheries in the 19-State weekly program set 218 million eggs in incubators during the week ending August 25, 2007. This was up 2 percent from the eggs set the corresponding week a year earlier. Average hatchability for chicks hatched during the week was 83 percent. Average hatchability is calculated by dividing chicks hatched during the week by eggs set three weeks earlier. Broiler-Type Chicks Hatched Up 2 Percent Broiler-type chicks hatched during July 2007 totaled 821 million, up 2 percent from July 2006. Eggs in incubators totaled 676 million on August 1, 2007, up 2 percent from a year earlier. Leading breeders placed 6.91 million broiler-type pullet chicks for future domestic hatchery supply flocks during July 2007, up 7 percent from July 2006 Turkey Eggs in Incubators on August 1 Up 9 Percent from Last Year Broiler Chicks Placed Up 2 Percent Broiler growers in the 19-State weekly program placed 178 million chicks for meat production during the week ending August 25, 2007. Placements were up 2 percent from the comparable week a year earlier. Cumulative placements from December 31, 2006 through August 25, 2007 were 6.01 billion, up 1 percent from the same period a year earlier July Egg Production Down 1 Percent U.S. egg production totaled 7.57 billion during July 2007, down 1 percent from last year. Production included 6.44 billion table eggs, and 1.14 billion hatching eggs, of which 1.07 billion were broiler-type and 66 million were egg-type. The total number of layers during July 2007 averaged 339 million, down 1 percent from last year. July egg production per 100 layers was 2,234 eggs, down slightly from July 2006. All layers in the U.S. on August 1, 2007 totaled 340 million, down slightly from last year. The 340 million layers consisted of 281 million layers producing table or market type eggs, 56.2 million layers producing broiler-type hatching eggs, and 2.72 million layers producing egg-type hatching eggs. Rate of lay per day on August 1, 2007, averaged 72.1 eggs per 100 layers, up 1 percent from August 1, 2006. Egg-Type Chicks Hatched Up 9 Percent Turkey eggs in incubators on August 1, 2007 in the United States totaled 33.5 million, up 9 percent from August 1, 2006. Eggs in incubators were up 1 percent from the July 1, 2007 total of 33.3 million eggs. Regional changes from the previous year were: East North Central up 1 percent, West North Central up 7 percent, North and South Atlantic up 15 percent, and South Central and West up 7 percent. Poults Hatched During July Up 4 Percent from Last Year Turkey poults hatched during July 2007 in the United States totaled 27.3 million, up 4 percent from July 2006. Poults hatched were up 2 percent from the June 2007 total of 26.7 million poults. Regional changes from the previous year were: East North Central up 3 percent, West North Central up 11 percent, North and South Atlantic up 5 percent, and South Central and West down 9 percent. Net Poults Placed During July Up 4 Percent from Last Year The 27.2 million net poults placed during July 2007 in the United States were up 4 percent from the number placed during the same month a year earlier. Net placements were up 3 percent from the June 2007 total of 26.3 million poults. Egg-type chicks hatched during July 2007 totaled 35.6 million, up 9 percent from July 2006. Eggs in incubators totaled 33.7 million on August 1, 2007, up 10 percent from a year ago. Domestic placements of egg-type pullet chicks for future hatchery supply flocks by leading breeders totaled 183,000 during July 2007, down 43 percent from July 2006. Page 5 of 9 Broiler Production Falls by 1.3 Percent slightly (0.4 percent) and exports in the second quarter were 7.4 percent higher at 1.39 billion pounds. According to the latest Economic Research Service (ERS) reports, with broiler meat production down 4.2 percent in June, the total for the second quarter of 2007 was 9.0 billion pounds, down 1.3 percent from the same period in 2006. This is the fourth consecutive quarter of year-over-year declines in broiler meat production. In the first half of 2007, broiler meat production was 17.6 billion pounds, down 2.7 percent from the same period in 2006. Over the first half of 2007, the number of broilers slaughtered was 4.4 billion, down 1.4 percent from a year earlier. The average broiler live weight at slaughter during the first 6 months of 2007 was 5.48 pounds, up 0.3 percent from the first half of 2006. The relatively small decline in birds slaughtered and the increase in the average live weight normally would have been expected to produce a larger amount of meat. However, over the first 6 months of 2007, the amount of meat produced per bird has consistently been lower than in the previous year. Broiler meat production is expected to total 18.1 billion pounds during the second half of 2007, up 2.3 percent from the same period in 2006. The growth in production is expected to come from the combination of a larger number of birds being placed for grow out and slightly higher average live weights at slaughter. The incentive for increasing broiler production has come from the much higher prices that processors have received over the last 6 months. However, this increase in prices has been somewhat offset by higher feed and energy costs. If feed prices only increase moderately in the coming months, processors will have some incentive to continue the expansion in production that is expected in the second half of 2007. The number of chicks being placed weekly for grow out has averaged approximately 178 million over the last 5 weeks (July 14 to August 11). This is up 2.2 percent from the same weekly period in 2006. Weekly chick placements have been above the previous year for approximately the last 4 months, and now the higher placement rate is expected to push up production in the third quarter. Broiler Exports Surge in June to 548 Million Pounds After being below the previous year in March, April, and May broiler exports surged in June to 548 million pounds, a 32-percent increase from June 2006 and one of the highest monthly totals ever. In addition, the broiler export data for 2006 has been revised, with the total for 2006 being lowered to 5.205 billion pounds, down 68 million pounds from the previous estimate. Most of this revision was due to a lowering of exports in the first quarter of 2006 to 1.27 billion pounds. With large shipments in June 2007 and the revisions to 2006 exports, the total pattern of exports has changed. With these changes, broiler exports in the first quarter of 2007 were up The increase in broiler exports in June 2007 was mostly the result of larger shipments to Russia, China, and Angola. Exports to Russia totaled 209 million pounds (up 89 percent), and shipments to Lithuania also were up strongly to 53 million pounds. Exports to Hong Kong/China were 69 million pounds, compared with only 39 million pounds in June 2006. Shipments to Angola totaled 24 million pounds, 286 percent higher than in the previous year. One area where broiler exports have fallen sharply is to Romania. Broiler exports to Romania have fallen due to its accession to the EU. As part of the EU, Romania now can not import U.S. broiler products. It had imported over 100 million pounds in the first half of 2006. With a higher volume of exports and higher prices for broiler products in the first half of 2007, especially leg quarters, the value of broiler exports was much higher than the previous year. In the first half of 2007, the value of broiler exports rose to $1.18 billion, which is $360 million higher than in the first half of 2006 (up 44 percent). Broiler exports in the second half of 2007 are estimated at 2.7 billion pounds, up 2.3 percent from the same period in 2006. The expected increase is due in large part to the expectation that broiler prices in the second half of 2007 will decline somewhat from the high levels seen in the first half of the year. Turkey Production Increases in First-Half 2007 Turkey production during the first 6 months of 2007 was 2.88 billion pounds, a 3.2-percent increase compared with a year earlier. The increase in turkey meat production is due to a 3.6-percent increase in the number of birds being slaughtered, as the average live weight of birds at slaughter in the first 6 months of 2007 was down slightly (0.3 percent) from the first 6 months of 2006. The forecast for turkey meat production in the second half of 2007 is for a 1.7-percent increase compared with the previous year to 2.94 billion pounds. The growth in production is again expected to come from a larger number of birds slaughtered, as the number of turkey poults placed for grow out during the first 6 months of 2007 totaled 156 million, up 5 percent from a year earlier. Even with higher turkey meat production expected in the second half of 2007, turkey stocks are expected to remain lower than the previous year. Even with the increase in production, the increase in turkey exports has helped keep turkey stocks at relatively low levels, which has in turn meant that turkey prices have continued to be well above their year-earlier levels. In July, the price of 8-16 pound whole hens in the Eastern market was 87 cents a pound, up 16 percent from a year earlier and 20 percent higher than the July 2005 price. Wholesale prices for whole turkeys are expected to remain higher than their year-earlier levels through the remainder of the year. Page 6 of 9 Turkey Exports Rise by 6 Percent Over the first 6 months of 2007, U.S. turkey exports totaled 260 million pounds, up 6 percent compared with the previous year. Exports were higher to many markets, primarily China, Russia, Canada, and Mexico. In addition to the higher volume of exports, the average unit price of turkey exports was higher in first-half 2007. The total value of turkey exports in the first half of 2007 was $185 million, a 15-percent increase from the same period in 2006. Turkey exports over the first half of 2007 were influenced by the high prices for most broiler products. With a gradual leveling off or lowering of broiler prices expected in second-half 2007, turkey exports are expected to have greater competition. The forecast for the second half of 2007 is for exports to total 295 million pounds, down somewhat from the same period in 2006. Egg Production Falls in First-Half 2007 After rising on a year-over-year basis in all four quarters of 2006, total egg production has fallen in the first two quarters of 2007. Production of table eggs for consumption was 3.18 billion dozen in the first half of 2007, down 1.4 percent from first-half 2006. The decline in table eggs was partially offset by a small increase (1.6 percent) in the production of hatching eggs to 548 million dozen. The increase in the production of hatching eggs occurred mostly in the second quarter as broiler producers began to expand production to allow for higher meat production in the second half of 2007. The smaller production of table eggs, along with a strong export market, has resulted in higher prices for eggs for most of the first half of 2007 and is continuing into the third quarter. Wholesale prices in the New York market averaged $1.15 per dozen in July, and weekly prices had gone as high as $1.19 per dozen in the beginning of August. Wholesale egg prices in the New York market are expected to average approximately $1.08 to $1.12 per dozen in the third quarter, but to decline slightly in the fourth quarter, as traditional high demand is offset by higher production. Egg exports in the first half of 2007 totaled 102 million dozen (these are shell eggs and egg products). In the traditional large markets, higher exports to Mexico and Hong Kong were offset by smaller shipments to Canada and Japan. The overall total has been boosted by much higher shipments to China and the EU. Exports to China in the first half of 2007 totaled 3.0 million dozen, up 217 percent from the same period in 2006. Shipments to the EU have been concentrated in the United Kingdom, the Netherlands, Germany, and Denmark. Together, shipments to these countries totaled 18 million dozen in the first 6 months of 2007, 190 percent higher than the previous year. Page 7 of 9 Current Month Charts Broiler Whole Bird Condemnation (Company) Broiler Performance Data (Company) Live Production Cost Average Co. % Septox % Airsac % I.P. % Leukosis % Bruise % Other % Total % 1/2 parts condemnations 0.137 0.060 0.023 0.001 0.002 0.009 0.232 0.327 Average Co. Feed cost/ton w/o color ($) Feed cost/lb meat (¢) Days to 4.6 lbs Chick cost/lb (¢) Vac-Med cost/lb (¢) WB & 1/2 parts condemn. cost/lb % mortality Sq. Ft. @ placement Lbs./Sq. Ft. Down time (days) Data for week ending July 21, 2007 Broiler Whole Bird Condemnation (Region) % Septox % Airsac % I.P. % Leukosis % Bruise % Other % Total % 1/2 parts condemnations SW MidWest S. East MidS. Atlantic Central 0.127 0.073 0.035 0.004 0.003 0.008 0.249 0.198 0.021 0.005 0.000 0.001 0.007 0.231 0.143 0.086 0.006 0.001 0.001 0.009 0.194 0.106 0.047 0.081 0.000 0.003 0.011 0.196 0.099 0.073 0.006 0.001 0.002 0.008 0.187 0.385 0.427 0.354 0.341 0.220 208.97 19.42 42 4.43 0.10 0.17 4.19 0.85 6.89 13 Data for week ending July 21, 2007 Data for week ending July 21, 2007 Previous Month Charts Broiler Performance Data (Company) Live Production Cost Broiler Performance Data (Region) — Live Production Cost SW Midwest Southeast Mid-Atlantic S-Central Feed cost/ton w/o color ($) Feed cost/lb meat (¢) Days to 4.6 lbs Chick cost/lb (¢) Vac-Med cost/lb (¢) WB & 1/2 parts condemn. cost/lb % mortality Sq. Ft. @ placement Lbs./Sq. Ft. Down time (days) 199.52 19.34 41 3.84 0.12 0.17 4.50 0.98 7.23 13 194.08 17.08 40 4.65 0.06 0.16 3.39 0.79 6.76 11 203.57 19.25 42 4.35 0.07 0.19 4.32 0.86 7.12 12 200.66 18.58 42 4.19 0.07 0.16 4.14 0.81 7.06 15 Average Co. 202.44 18.63 41 4.68 0.12 0.13 4.75 0.82 6.75 13 Feed cost/ton w/o color ($) Feed cost/lb meat (¢) Days to 4.6 lbs Chick cost/lb (¢) Vac-Med cost/lb (¢) WB & 1/2 parts condemn. cost/lb % mortality Sq. Ft. @ placement Lbs./Sq. Ft. Down time (days) Data for week ending June 23, 2007 200.63 18.70 42 4.42 0.11 0.17 4.40 0.86 6.91 13 Data for week ending June 23, 2007 Broiler Whole Bird Condemnation (Region) % Septox % Airsac % I.P. % Leukosis % Bruise % Other % Total % 1/2 parts condemnations SW MidWest S. East 1.32 0.081 0.032 0.003 0.003 0.011 0.262 1.98 0.025 0.005 0.000 0.001 0.006 0.232 0.148 0.041 0.006 0.001 0.001 0.009 0.206 0.172 0.086 0.037 0.000 0.003 0.010 0.308 0.096 0.107 0.005 0.000 0.002 0.009 0.217 0.365 0.475 0.331 0.323 0.196 Data for week ending June 23, 2007 Broiler Whole Bird Condemnation (Company) MidS. Atlantic Central Average Co. % Septox % Airsac % I.P. % Leukosis % Bruise % Other % Total % 1/2 parts condemnations 0.149 0.073 0.021 0.001 0.002 0.009 0.256 0.315 Data for week ending June 23, 2007 Page 8 of 9 Meetings, Seminars and Conventions 2007 September September 12-15: 15th Congress of the World Veterinary Poultry Association, Jiuhua Grand Hotel, Beijing, P.R. China. Contact: Scientific issues: Dr. Xiaoling Chen. The Poultry Health Branch of the Chinese Association of Animal Science & Veterinary Medicine (CAAV), PO Box 2449-21, Beijing 1000089, P.R. China; Phone: +86 10 6217 4126; Email: llwang@wvpc2007.org; Website: www.wvpc2007.org September 25-28: 20th Latin American Poultry Congress, FIERGS Events Centre, Porto Alegre, Brazil. Contact: Website: www.avicultura2007.com.br September 26-28: 5th European Poultry Genetic Symposium 2007, Braedstrup-Horsens, Denmark. Contact: Dr. Poul Sorensen, Email: poul.sorensen@agrsci.dk; Website: www.epgs2007.agrsci.dk 2007 October October 3-4: NCC Board/Annual Mtng., Ritz Carlton Pentagon City, Arlington, VA. Contact: National Chicken Council, 1015 15th St, N.W., Suite 930, Washington, D.C. 20002. Phone: 202-296-2622; http://www.nationalchickencouncil.com; http:www.//eatchicken.com October 3-4: Advanced HACCP For Meat & Poultry Processors, University of Georgia, Athens, GA. Contact: Marian Wendinger, University of Georgia, 240 Food Science Bldg., Athens, GA 306027610. Phone: 706-542-2574; marianw@uga.edu; http://www.efsonline.uga.edu October 5-8: KPF Poultry Festival, Marriott Downtown Hotel, Louisville, KY. Contact: Kentucky Poultry Federation, P.O. Box 21829, Lexington, KY 40522-1829. Phone: 859-373-0751; melissamiller@kypoultry.org; http://kypoultry.org October 8-10: 2007 National Meeting on Poultry Health Processing, Clarion Resort Fountainebleau Hotel, Ocean City, Maryland. Contact: Karen Adams, Delmarva Poultry Industry, Inc., 16686 County Seat Highway, Georgetown, Delaware COBB-VANTRESS October 10-11: PFProcessors Workshop, Fayetteville, Ark. Contact: Paulette Binkley, the Poultry Federation, 321 S. Victory, Little Rock, Ark. 72201. Phone: 501-375-8131; http://www.the-poultryfederation.com 2008 January January 23-25: International Poultry Expo 2008, Georgia World Congress Center, Atlanta, Georgia. Contact: US Poultry & Egg Association, 1530 Cooledge Road, Tucker, Georgia 30084-7804. Phone: 1-770-493-9401; Fax: 1-770-493-9257; Email: expogeneralinfo@poultryegg.org. Website: www.poultryegg.org or www.ipe08.org 2008 March March 5-6: Nebraska Poultry Industries Annual Convention, New World Inn & Conference Center, Columbus, Nebraska. Contact: Nebraska Poultry Industries, Inc. University of Nebraska, A103 Animal Sciences, PO Box 830908, Lincoln, Nebraska 68583-0908; Phone: 1-402-472-2051. March 5-7: Victam Asia 2008, Bangkok, Thailand. Contact: Henk van de Bunt, Victam International B.V., P.O. Box 197, 3860 AD Nijkerk, The Netherlands, Phone: +31 33 246 4404, Fax: +31 33 246 4706, Email: expo@victam.com; Website: www.victam.com or Contact: Mr. Phusit Sasitaranondha, Thailand, Phone: +66 2 640 8013; Fax: +66 2 664 2076; Email: phusit@expolink.net 2008 June June 29-July 4: XXIII World’s Poultry Congress, Convention and Exhibition Centre, Brisbane, Australia. Contact: WPC 2008 Congress, Intermedia Convention & Event Management, PO Box 1280, Milton, Queensland 4064, Australia, Phone: +61 7 3858 5594; Fax: +61 7 3858 5510; Email: wpc2008@im.com.au; Website: www.wpc2008.com Primary Breeders Veterinary Association 2008 August August 17-21: 8th International Marek’s Disease Symposium, Townsville, Queensland, Australia. Contact: Dr. G. Burgess, School of Veterinary & Biomedical Sciences, James Cook University, Townsville, Queensland 4811, Australia. Phone: +61 7 4781 5472; Fax: +61 7 4781 6833; Email: graham.burgess@jcu.edu.au 2009 January January 28-30: International Poultry Expo 2009, Georgia World Congress Center, Atlanta, Georgia. Contact: US Poultry & Egg Association, 1530 Cooledge Road, Tucker, Georgia 30084-7804. Phone: +1 770 493 9401; Fax: +1 770 493 9257; Email: expogeneralinfo@poultryegg.org. Website: www.poultryegg.org 2010 April April 20-23: VIV Europe 2010, Utrecht, The Netherlands. Contact: XNU Exhibitions Europe B.V., P.O. Box 8800, 3503 RV Utrecht, The Netherlands, Fax: +31 30 295 2809; Website: www.viv.net The University of Georgia is committed to the principle of affirmative action and shall not discriminate against otherwise qualified persons on the basis of race, color, religion, national origin, sex, age, physical or mental handicap, disability, or veteran’s status in its recruitment, admissions, employment, facility and program accessibility, or services. REMINDER All previous issues of the Poultry Informed Professional are archived on our website www.avian.uga.edu under the Online Documents and The Poultry Informed Professional links. The Poultry Informed Professional Newsletter is published with support from The Primary Breeders Veterinary Association. Page 9 of 9
