Document 13137863
advertisement

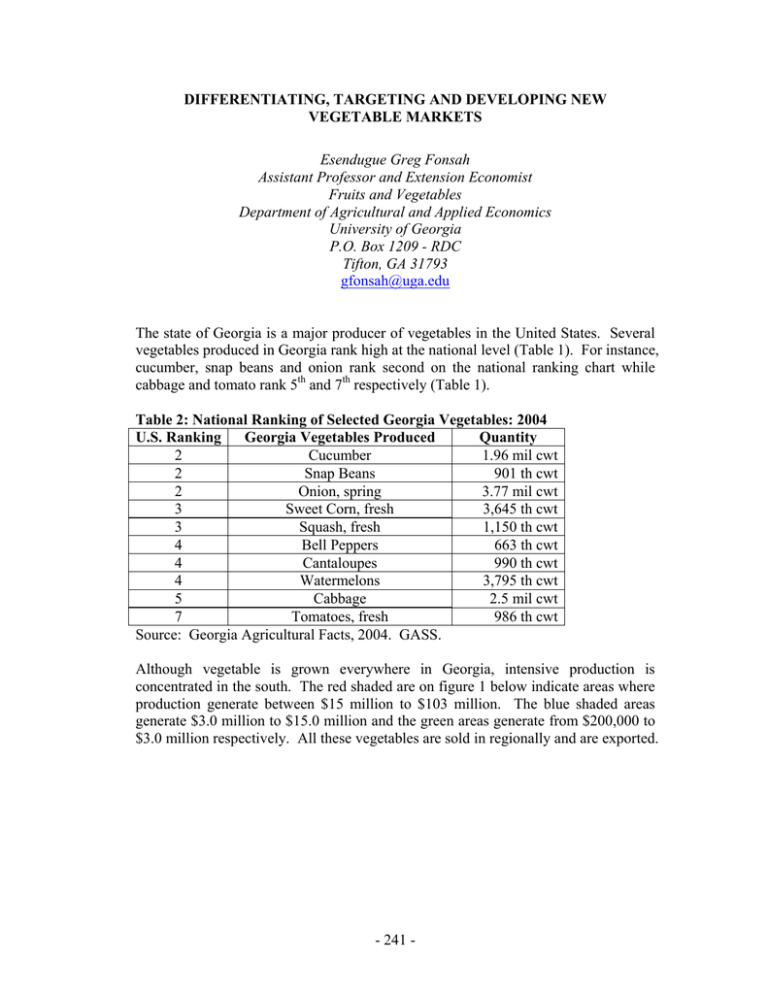
DIFFERENTIATING, TARGETING AND DEVELOPING NEW VEGETABLE MARKETS Esendugue Greg Fonsah Assistant Professor and Extension Economist Fruits and Vegetables Department of Agricultural and Applied Economics University of Georgia P.O. Box 1209 - RDC Tifton, GA 31793 gfonsah@uga.edu The state of Georgia is a major producer of vegetables in the United States. Several vegetables produced in Georgia rank high at the national level (Table 1). For instance, cucumber, snap beans and onion rank second on the national ranking chart while cabbage and tomato rank 5th and 7th respectively (Table 1). Table 2: National Ranking of Selected Georgia Vegetables: 2004 U.S. Ranking Georgia Vegetables Produced Quantity 2 Cucumber 1.96 mil cwt 2 Snap Beans 901 th cwt 2 Onion, spring 3.77 mil cwt 3 Sweet Corn, fresh 3,645 th cwt 3 Squash, fresh 1,150 th cwt 4 Bell Peppers 663 th cwt 4 Cantaloupes 990 th cwt 4 Watermelons 3,795 th cwt 5 Cabbage 2.5 mil cwt 7 Tomatoes, fresh 986 th cwt Source: Georgia Agricultural Facts, 2004. GASS. Although vegetable is grown everywhere in Georgia, intensive production is concentrated in the south. The red shaded are on figure 1 below indicate areas where production generate between $15 million to $103 million. The blue shaded areas generate $3.0 million to $15.0 million and the green areas generate from $200,000 to $3.0 million respectively. All these vegetables are sold in regionally and are exported. - 241 - Fig. 1: Georgia Vegetable Production Area/ Counties and Farm Value: 2004 $0 - $10,000 $10,000 - $200,000 $200,000 - $3,000,000 $3,000,000 - $15,000,000 $15,000,000 - $102,300,000 At the national level, vegetable production and area harvested are declining. Figure 2 shows that area harvested decreased by 4.8% in 2002 compared with 2003 and by 2.0% decrease from 2003 to 2004. On the other hand, production decreased by 2.5% in 2002 compared to 2003 and there was no change thereafter (Fig 2). Fig 2: U.S. Vegetable Industry, Area & Production, 2002-2004 Area Harvested Production 7000 1330 6900 1320 1310 6700 6600 1300 6500 1290 6400 1280 6300 6200 1270 2002 2003 2004 - 242 - (M illio n c w t) (1 ,0 0 0 a c re s ) 6800 At the world scene, a total of 58% of all fresh vegetable produced are exported to the EU whereas only 26% goes to the NAFTA countries i.e. Canada, Mexico and United States and 8% goes to Asia. A small amount goes to the Middle East and South America respectively (Fig. 2). Fig 2: World Export Destination of Fresh Vegetable Average, 1999-2001 Fresh Vegetable Middle East 2% S. AMER 1% ASIA 8% Others 5% EU 58% NAFTA 26% Source: USDA/ERS Outlook (June 2004). WRS-04-06, www.ers.usda.gov On the other hand, figure 3 shows that 56% of all vegetables produced are imported by the EU while only 23% are imported by the NAFTA countries. A little quantity was imported by the Southern Hemisphere, Asia and the Middle East (Fig 3). - 243 - Fig 3: Destination of fresh vegetables imported: 1990-2000 average Fresh Vegetables Banana exp Mid. East S. countries 3% Hemisphere 0.4% 4% Asia Others 7% 7% NAFTA 23% EU 56% USDA/ERS Outlook (June 2004). WRS-04-06, www.ers.usda.gov Furthermore, in 2002 and 2003, Canada invested $8.5 billion and $9.1 billion in the purchase of fruits and vegetable from the United States. Japan import from the United States during the same time period was $8.3 billion and $9.0 billion respectively. Mexico was third with $7.1 billion and $7.6 billion in 2002 and 2003 respectively. The EU only purchased $6.2 million and $5.8 million in 2002 and 2003. However, while Canada, Japan and Mexico increased their share from 2002 to 2003, the EU’s share decreased. Conclusion Although NAFTA agreement has actually improved trade ties between Canada, Mexico and the United States these countries import and export share of fresh vegetables were 23% and 26% respectively. The bulk of all import and export goes to the EU where the United States is still reluctant to explore. It would be a good marketing strategy if we continue to improve or share in the NAFTA member country markets and start exploring the possibility of increasing our market share in the EU marketplace. - 244 -
