On-Orbit Byron Smiley*, Jerry Harder, Juan Fontenla, George Lawrence, and Gary... Laboratory for Atmospheric and Space Physics (LASP) Boulder, Colorado
advertisement
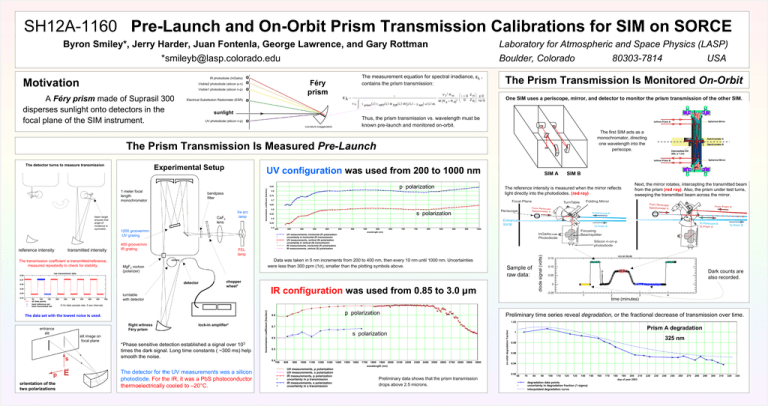
Byron Smiley*, Jerry Harder, Juan Fontenla, George Lawrence, and Gary Rottman *smileyb@lasp.colorado.edu The measurement equation for spectral irradiance, ελ , contains the prism transmission: IR photodiode (InGaAs) Féry prism Visible2 photodiode (silicon p-n) Visible1 photodiode (silicon n-p) A Féry prism made of Suprasil 300 disperses sunlight onto detectors in the focal plane of the SIM instrument. Laboratory for Atmospheric and Space Physics (LASP) Boulder, Colorado 80303-7814 USA 2 ελ Electrical Substitution Radiometer (ESR) 1 ó f ⋅ L ⋅ ô τ prism( λ ) ⋅τ HRT( λ ) ⋅Φ Diff ( λ ) ⋅ W y ( λ ) − y set ⋅ α ( λ ) dλ ô õ ( ⋅ ) V 7 ⋅R H ( )2 M⋅ R s + R H æ 1 + G Z H ö p ⋅D ⋅ ÷⋅ è G Z R ø Λp ⋅ Q ⋅ç The Prism Transmission Is Monitored On-Orbit One SIM uses a periscope, mirror, and detector to monitor the prism transmission of the other SIM. sunlight Thus, the prism transmission vs. wavelength must be known pre-launch and monitored on-orbit. UV photodiode (silicon n-p) (curvature exaggerated) The first SIM acts as a monochromator, directing one wavelength into the periscope. The Prism Transmission Is Measured Pre-Launch Experimental Setup UV configuration was used from 200 to 1000 nm p polarization 1 meter focal length monochromator beam target ensures that angle of incidence is symmetric reference intensity transmitted intensity The transmission coefficient is transmitted/reference, measured repeatedly to check for stability. raw transmission data bandpass filter Xe arc lamp CaF2 lens transmission coefficient (fraction) 0.85 0.8 0.75 0.7 Focal Plane 0.6 0.5 0.4 400 groove/mm IR grating 200 250 300 350 400 450 500 550 600 wavelength (nm) 650 700 750 800 850 900 950 FEL lamp detector 0.05 0.04 Silicon n-on-p photodiode Sample of raw data: 50 100 150 all data points best reference set best transmitted set 200 250 300 350 400 450 500 8 Hz data sample rate, 5 sec intervals The data set with the lowest noise is used. entrance slit flight witness Féry prism slit image on focal plane lock-in amplifier* *Phase sensitive detection established a signal over 103 times the dark signal. Long time constants ( ~300 ms) help smooth the noise. The detector for the UV measurements was a silicon photodiode. For the IR, it was a PbS photoconductor thermoelectrically cooled to –20°C. p polarization 0.8 Preliminary time series reveal degradation, or the fractional decrease of transmission over time. 1.02 0.7 s polarization 0.6 0.5 0.4 700 orientation of the two polarizations Dark counts are also recorded. time (minutes) 800 900 1000 1100 1200 1300 UV measurements, p polarization UV measurements, s polarization IR measurements, p polarization uncertainty in p transmission IR measurements, s polarization uncertainty in s transmission 1400 1500 1600 1700 1800 1900 2000 wavelength (nm) 2100 2200 2300 2400 2500 2600 2700 2800 2900 3000 on-orbit degradation fraction 0 IR configuration was used from 0.85 to 3.0 µm turntable with detector transmission coefficient (fraction) 0.03 chopper wheel* To Prism B Focusing Beamsplitter InGaAs Photodiode 0.08 0.06 To Periscope B To Prism A To Prism B 1000 Data was taken in 5 nm increments from 200 to 400 nm, then every 10 nm until 1000 nm. Uncertainties were less than 300 ppm (1σ), smaller than the plotting symbols above. 0.07 From Prism A To Periscope B Entrance Slit B UV measurements, horizontal (P) polarization uncertainty in horizontal (P) transmission UV measurements, vertical (S) polarization uncertainty in vertical (S) transmission IR measurements, horizontal (P) polarization IR measurements, vertical (S) polarization MgF2 rochon (polarizer) From Periscope Spectrometer A From Periscope Spectrometer A Periscope s polarization Next, the mirror rotates, intercepting the transmitted beam from the prism (red ray). Also, the prism under test turns, sweeping the transmitted beam across the mirror. Folding Mirror TurnTable 0.65 0.55 SIM B The reference intensity is measured when the mirror reflects light directly into the photodiodes. (red ray) 0.45 1200 groove/mm UV grating SIM A diode signal (volts) The detector turns to measure transmission Prism A degradation 1 325 nm 0.98 0.96 0.94 0.92 Preliminary data shows that the prism transmission drops above 2.5 microns. 60 70 80 90 100 110 120 130 140 degradation data points uncertainty in degradation fraction (1 sigma) interpolated degradation curve 150 160 170 180 190 200 210 day of year 2003 220 230 240 250 260 270 280 290 300 310 320 330
