Fall 2009 Cohort Fall 09 Spring 10 Fall 10
advertisement

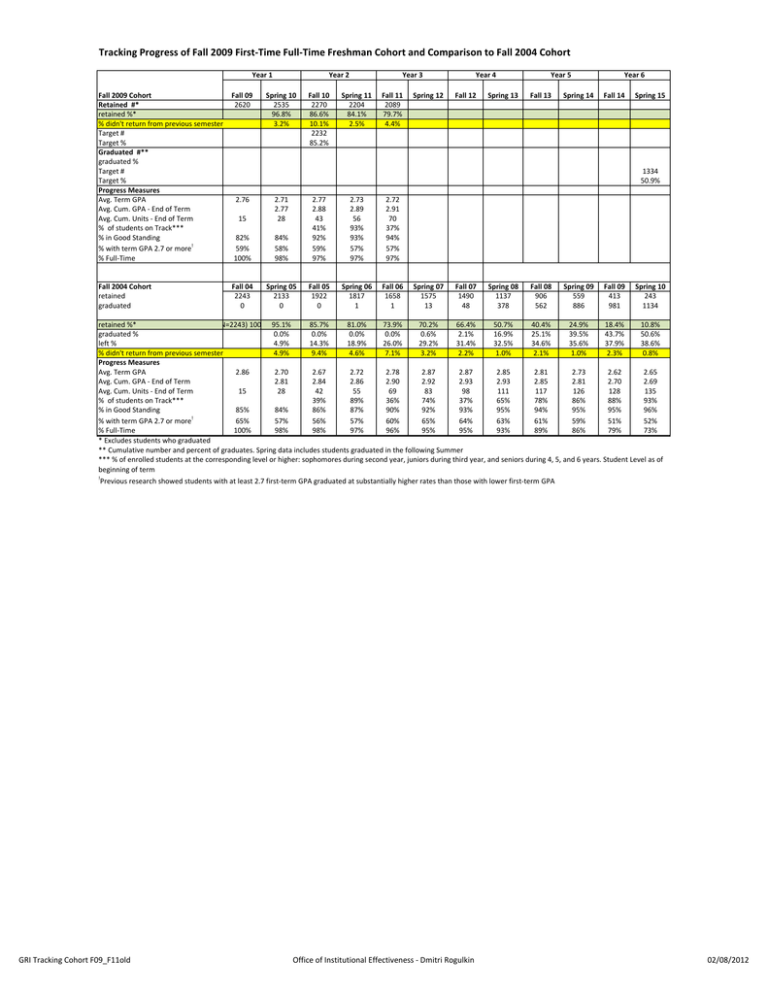
Tracking Progress of Fall 2009 First-Time Full-Time Freshman Cohort and Comparison to Fall 2004 Cohort Year 1 Fall 2009 Cohort Retained #* retained %* % didn't return from previous semester Target # Target % Graduated #** graduated % Target # Target % Progress Measures Avg. Term GPA Avg. Cum. GPA - End of Term Avg. Cum. Units - End of Term % of students on Track*** % in Good Standing % with term GPA 2.7 or more! % Full-Time Fall 09 2620 Fall 2004 Cohort retained graduated Year 2 Spring 10 2535 96.8% 3.2% Fall 10 2270 86.6% 10.1% 2232 85.2% Year 3 Spring 11 2204 84.1% 2.5% Fall 11 2089 79.7% 4.4% Spring 12 Year 4 Fall 12 Spring 13 Year 5 Fall 13 Spring 14 Year 6 Fall 14 Spring 15 1334 50.9% 2.76 15 2.71 2.77 28 82% 59% 100% 84% 58% 98% 2.77 2.88 43 41% 92% 59% 97% Fall 04 2243 0 Spring 05 2133 0 Fall 05 1922 0 2.73 2.89 56 93% 93% 57% 97% 2.72 2.91 70 37% 94% 57% 97% Spring 06 1817 1 Fall 06 1658 1 Spring 07 1575 13 Fall 07 1490 48 Spring 08 1137 378 Fall 08 906 562 Spring 09 559 886 Fall 09 413 981 Spring 10 243 1134 81.0% retained %* N=2243) 100 95.1% 85.7% 73.9% 70.2% 66.4% 50.7% 40.4% 24.9% 18.4% 10.8% 0.0% graduated % 0.0% 0.0% 0.0% 0.6% 2.1% 16.9% 25.1% 39.5% 43.7% 50.6% left % 4.9% 14.3% 18.9% 26.0% 29.2% 31.4% 32.5% 34.6% 35.6% 37.9% 38.6% % didn't return from previous semester 4.9% 9.4% 0.8% 4.6% 7.1% 3.2% 2.2% 1.0% 2.1% 1.0% 2.3% Progress Measures Avg. Term GPA 2.86 2.70 2.62 2.65 2.67 2.72 2.78 2.87 2.87 2.85 2.81 2.73 2.81 2.70 2.69 Avg. Cum. GPA - End of Term 2.81 2.84 2.86 2.90 2.92 2.93 2.93 2.85 Avg. Cum. Units - End of Term 15 28 42 55 69 83 98 111 117 126 128 135 % of students on Track*** 39% 89% 36% 74% 37% 65% 78% 86% 88% 93% % in Good Standing 85% 84% 86% 87% 90% 92% 93% 95% 94% 95% 95% 96% ! % with term GPA 2.7 or more 65% 57% 56% 57% 60% 65% 64% 63% 61% 59% 51% 52% % Full-Time 100% 98% 98% 97% 96% 95% 95% 93% 89% 86% 79% 73% * Excludes students who graduated ** Cumulative number and percent of graduates. Spring data includes students graduated in the following Summer *** % of enrolled students at the corresponding level or higher: sophomores during second year, juniors during third year, and seniors during 4, 5, and 6 years. Student Level as of beginning of term ! Previous research showed students with at least 2.7 first-term GPA graduated at substantially higher rates than those with lower first-term GPA GRI Tracking Cohort F09_F11old Office of Institutional Effectiveness - Dmitri Rogulkin 02/08/2012 Tracking Progress and GAP between Underrepresented Minority and Traditional Race/Ethnicity (Non-URM)* First-Time Full-Time Freshman Cohorts, Fall 2009 and Fall 2004 Year 1 Fall 2009 Cohort: URM URM Cohort Size % Retained (Cumulative) % Graduated (Cumulative) % Left (Cumulative) Avg. Term GPA Avg. Cum. GPA - End of Term Avg. Cum. Units - End of Term % of Students on Track % in Good Standing % with Term GPA 2.7 or more % Full-Time Fall 2009 Cohort: Non-URM Non-URM Cohort Size % Retained (Cumulative) % Graduated (Cumulative) % Left (Cumulative) Avg. Term GPA Avg. Cum. GPA - End of Term Avg. Cum. Units - End of Term % of Students on Track % in Good Standing % with Term GPA 2.7 or more % Full-Time Fall 09 1135 100.0% Year 2 Year 3 Spring 10 Fall 10 Spring 11 Fall 11 96.9% 85.1% 81.7% 77.7% 14 3.1% 2.56 2.62 26 78% 53% 100% 80% 51% 98% 14.9% 2.60 2.75 41 35% 90% 50% 96% 18.3% 2.60 2.77 53 91% 91% 50% 97% 22.3% 2.56 2.79 67 29% 93% 49% 97% 1485 100.0% 96.6% 87.8% 86.0% 81.3% 16 3.4% 2.83 2.88 30 85% 64% 100% 86% 64% 98% 12.2% 2.89 2.98 45 46% 94% 65% 97% 14.0% 2.82 2.98 58 94% 94% 62% 96% 18.7% 2.83 3.00 73 43% 95% 63% 96% 2.62 2.87 Year 1 Fall 2009 Cohort: URM GAP** Cohort Size % Retained (Cumulative) % Graduated (Cumulative) Fall 04 -350 Avg. Term GPA Avg. Cum. GPA - End of Term Avg. Cum. Units - End of Term % of Students on Track % in Good Standing % with Term GPA 2.7 or more % Full-Time -0.25 Year 2 Spring 12 Year 4 Fall 12 Year 3 Spring 05 Fall 05 Spring 06 Fall 06 0.3% -2.7% -4.3% -3.6% -2 -0.26 -0.26 -4 -6% -12% 0% -6% -13% 0% -0.28 -0.23 -4 -11% -4% -16% -1% -0.22 -0.21 -5 -4% -2% -12% 1% -0.27 -0.21 -6 -14% -2% -13% 0% Spring 07 Spring 13 Year 5 Fall 13 Year 4 Fall 07 Spring 08 Spring 14 Year 6 Fall 14 Year 5 Fall 08 Spring 09 Spring 15 Year 6 Fall 09 Spring 10 *URM: African American, American Indian, Hispanic, Native Hawaiians or Pacific Islanders Non-URM: White, Asian, Non-Resident Alien, Two-or-More, Unknown **Negative GAP means that an URM measure value is less than Non-URM measure value Year 1 Fall 2004 Cohort: URM URM Cohort Size % Retained (Cumulative) % Graduated (Cumulative) % Left (Cumulative) Avg. Term GPA Avg. Cum. GPA - End of Term Avg. Cum. Units - End of Term % of Students on Track % in Good Standing % with Term GPA 2.7 or more % Full-Time Fall 2004 Cohort: Non-URM Non-URM Cohort Size % Retained (Cumulative) % Graduated (Cumulative) % Left (Cumulative) Avg. Term GPA Avg. Cum. GPA - End of Term Avg. Cum. Units - End of Term % of Students on Track % in Good Standing % with Term GPA 2.7 or more % Full-Time Fall 04 832 100.0% Year 2 Year 4 Year 5 Year 6 Spring 05 Fall 05 Spring 06 Fall 06 Spring 07 Fall 07 Spring 08 Fall 08 Spring 09 Fall 09 Spring 10 95.0% 83.9% 79.1% 73.1% 14 100% 81% 60% 100% 5.0% 2.57 2.70 26 100% 80% 51% 98% 16.1% 2.51 2.73 39 34% 82% 48% 98% 20.9% 2.52 2.72 52 87% 84% 46% 98% 26.9% 2.59 2.75 65 27% 85% 52% 96% 69.0% 0.4% 30.6% 2.68 2.77 79 67% 89% 56% 94% 67.3% 0.7% 32.0% 2.70 2.78 92 29% 90% 57% 94% 55.3% 10.7% 34.0% 2.70 2.79 106 56% 93% 56% 91% 45.0% 17.5% 37.5% 2.68 2.76 114 74% 93% 56% 92% 28.5% 33.1% 38.5% 2.62 2.73 124 84% 93% 55% 87% 20.3% 37.6% 42.1% 2.47 2.61 125 86% 93% 47% 82% 12.6% 44.5% 42.9% 2.52 2.61 133 94% 97% 44% 73% 1411 100.0% 95.2% 86.7% 4.8% 2.78 2.87 29 100% 86% 61% 99% 13.3% 2.76 2.90 43 42% 87% 61% 98% 82.1% 0.1% 17.8% 2.83 2.94 57 91% 89% 63% 96% 74.4% 0.1% 25.5% 2.89 2.98 72 42% 93% 65% 96% 70.9% 0.7% 28.3% 2.98 3.00 86 78% 94% 70% 95% 65.9% 3.0% 31.1% 2.97 3.02 101 42% 95% 69% 96% 48.0% 20.5% 31.5% 2.94 3.01 114 70% 96% 67% 94% 37.7% 29.5% 32.8% 2.89 2.91 119 80% 95% 64% 88% 22.8% 43.3% 33.9% 2.81 2.87 128 87% 96% 62% 86% 17.3% 47.3% 35.4% 2.72 2.76 130 89% 96% 54% 77% 9.8% 54.1% 36.1% 2.73 2.73 137 92% 94% 57% 73% 2.75 2.92 16 100% 87% 68% 100% Year 1 Fall 2004 Cohort: URM GAP** Cohort Size % Retained (Cumulative) % Graduated (Cumulative) Fall 04 -579 Avg. Term GPA Avg. Cum. GPA - End of Term Avg. Cum. Units - End of Term % of Students on Track % in Good Standing % with Term GPA 2.7 or more % Full-Time -0.17 GRI Tracking Cohort F09_F11old Year 3 Year 2 Year 3 Year 4 Year 5 Year 6 Spring 05 Fall 05 Spring 06 Fall 06 Spring 07 Fall 07 Spring 08 Fall 08 Spring 09 Fall 09 Spring 10 -0.2% -2.9% -3.1% -1.3% -0.1% -2.0% -0.3% 1.4% -2.3% 7.3% -9.8% 7.2% -11.9% 5.7% -10.2% 3.0% -9.7% 2.8% -9.7% -2 -0.21 -0.17 -3 -6% -8% 0% -5% -10% -1% -0.25 -0.17 -4 -8% -5% -13% 0% -0.31 -0.22 -5 -4% -5% -17% 2% -0.30 -0.23 -6 -15% -8% -13% 1% -0.30 -0.22 -7 -11% -5% -14% -1% -0.27 -0.25 -9 -13% -5% -12% -2% -0.25 -0.22 -8 -13% -3% -11% -3% -0.21 -0.15 -5 -6% -3% -8% 4% -0.19 -0.14 -4 -4% -3% -8% 1% -0.25 -0.16 -5 -3% -3% -7% 5% -0.21 -0.12 -4 2% 3% -12% 0% Office of Institutional Effectiveness - Dmitri Rogulkin 02/08/2012


