Sequential Injection Analysis (SI) Explained
advertisement
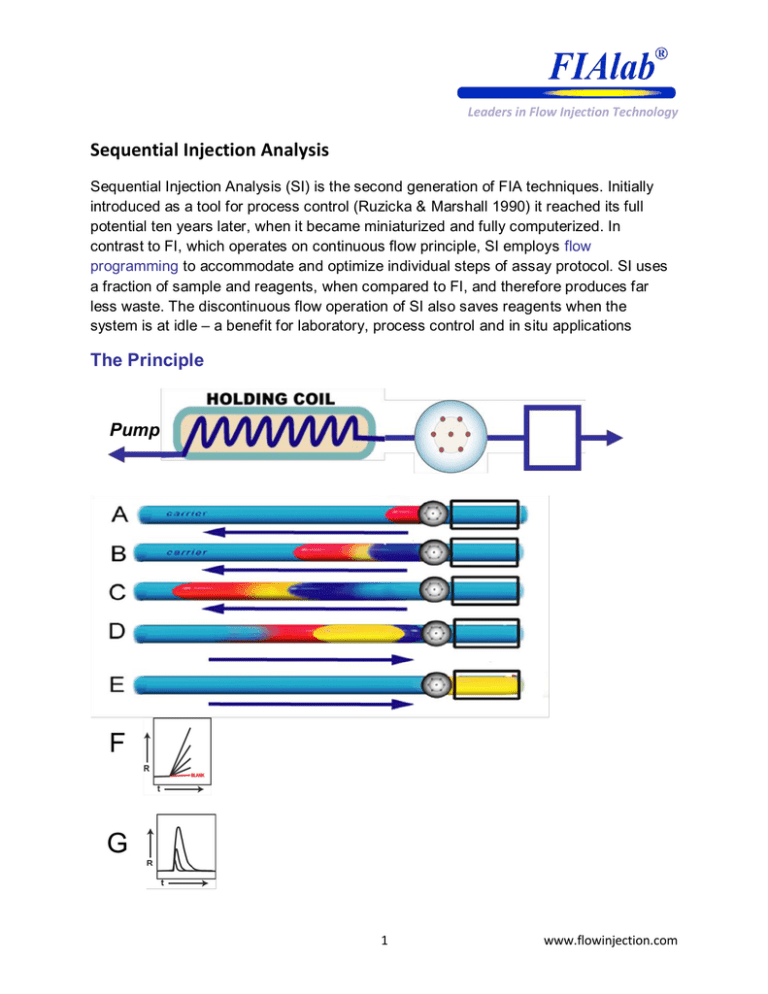
Leaders in Flow Injection Technology Sequential Injection Analysis Sequential Injection Analysis (SI) is the second generation of FIA techniques. Initially introduced as a tool for process control (Ruzicka & Marshall 1990) it reached its full potential ten years later, when it became miniaturized and fully computerized. In contrast to FI, which operates on continuous flow principle, SI employs flow programming to accommodate and optimize individual steps of assay protocol. SI uses a fraction of sample and reagents, when compared to FI, and therefore produces far less waste. The discontinuous flow operation of SI also saves reagents when the system is at idle – a benefit for laboratory, process control and in situ applications The Principle Pump F G p 1 www.flowinjection.com Leaders in Flow Injection Technology SI is based on programmable, bidirectional discontinuous flow, precisely choreographed by computer control. The system is comprised of a bidirectional pump, holding coil, multi-position valve (MPV) and a detector. The assay protocol has the following steps: A) Sample injection is achieved by aspirating an exact volume of analyte (red) via MPV into the holding coil, followed by B) Selected volume of reagent (blue) aspirated sequentially. C) as the stacked zones move upstream and mutually disperse within each other, the reaction product (yellow) starts to form. D) Upon flow reversal sample and reagent zones continue to mix and react. E) The reaction mixture reaches the flow cell where the reaction product is monitored. For very fast reactions the reaction product is continuously moved through the detector yielding a peak the height of which is proportional to the analyte concentration. (F) For slower reactions, the reaction product can be arrested within the detector, yielding a reaction rate curve (G) , the slope of which is proportional to concentration of analyte. In this way, all samples are processed in exactly the same way, allowing comparison of standards with unknowns. At the end of the assay cycle the system is washed out by fast forward flow rate. Example: Enzymatic Assay of Histamine A@460nm 6ppm 4ppm 2ppm Blank All response curves are recorded in duplicate and interposed atop each other 2 www.flowinjection.com Leaders in Flow Injection Technology Indicator (yellow, 50 mcrL), enzyme (purple, 30mcrL) and sample ( red 30mcrL) were sequentially aspirated into holding coil, held there for 20 seconds and continuously flown trough a detector, where absorbance was recorded. (Enzyme kit #1032 Bioscientific Austin Texas.) Example: Enzymatic Assay of Glucose Sample (red 50 mcrL), loaded into holding coil, was followed by enzyme indicator mixture (purple 25 mcrL). Next, the flow reversal transported the reacting mixture into the flow cell, where it was held for 25 seconds for reaction rate measurement, while increasing absorbance was recorded. (Hexokinase/glucose-6-phosphate dehydrogenase method, Sigma kit). Flow Injection or microSequential Injection? Briefly, microSI-LOV is far more economical in terms of reagent and sample consumption and more robust and reliable than FI. This is because the flow system is compact and uses syringe pump as the fluid drive. The flexibility of software control translates into instrument versatility unprecedented with any other microfluidic system. The only drawbacks of SI compared to FI is its lower sampling frequency (typically one sample/minute) and inability to mix more than three reagents with the sample effectively. 3 www.flowinjection.com
