Mean and Median Age of Students STUDENT DEMOGRAPHICS Mean Median
advertisement
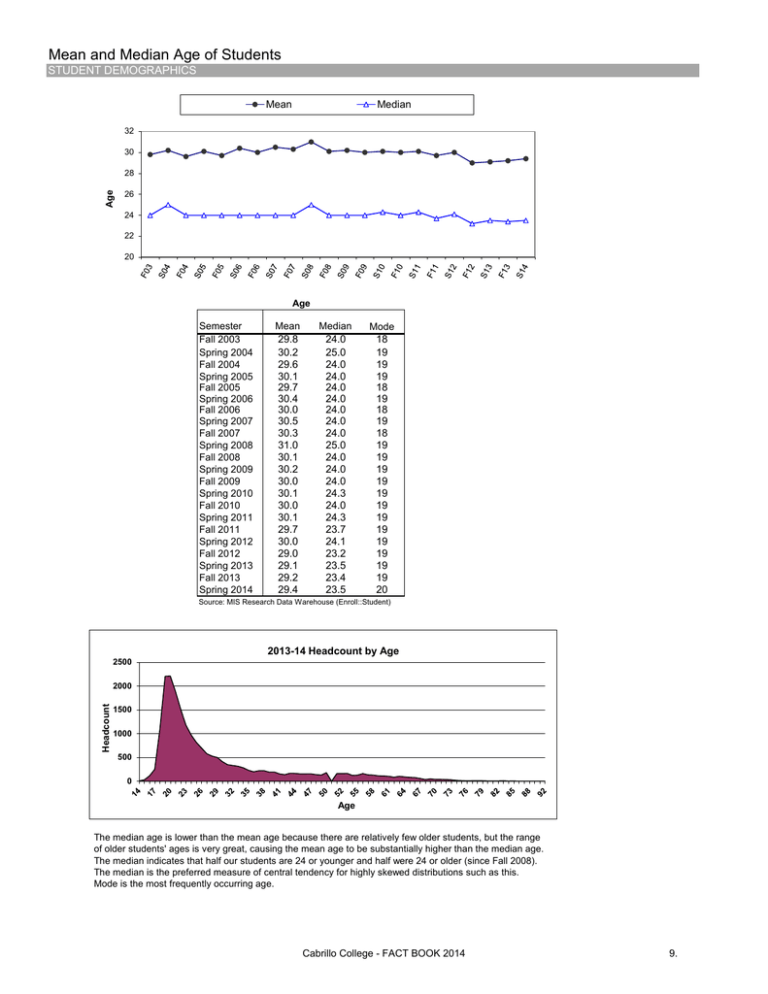
Mean and Median Age of Students STUDENT DEMOGRAPHICS Mean Median 32 30 Age 28 26 24 22 20 Age Semester Fall 2003 Spring 2004 Fall 2004 Spring 2005 Fall 2005 Spring 2006 Fall 2006 Spring 2007 Fall 2007 Spring 2008 Fall 2008 Spring 2009 Fall 2009 Spring 2010 Fall 2010 Spring 2011 Fall 2011 Spring 2012 Fall 2012 Spring 2013 Fall 2013 Spring 2014 Mean 29.8 30.2 29.6 30.1 29.7 30.4 30.0 30.5 30.3 31.0 30.1 30.2 30.0 30.1 30.0 30.1 29.7 30.0 29.0 29.1 29.2 29.4 Median 24.0 25.0 24.0 24.0 24.0 24.0 24.0 24.0 24.0 25.0 24.0 24.0 24.0 24.3 24.0 24.3 23.7 24.1 23.2 23.5 23.4 23.5 Mode 18 19 19 19 18 19 18 19 18 19 19 19 19 19 19 19 19 19 19 19 19 20 Source: MIS Research Data Warehouse (Enroll::Student) 2013-14 Headcount by Age 2500 Headcount 2000 1500 1000 500 0 Age The median age is lower than the mean age because there are relatively few older students, but the range of older students' ages is very great, causing the mean age to be substantially higher than the median age. The median indicates that half our students are 24 or younger and half were 24 or older (since Fall 2008). The median is the preferred measure of central tendency for highly skewed distributions such as this. Mode is the most frequently occurring age. Cabrillo College - FACT BOOK 2014 9.

