Report Descriptions by Tab
advertisement
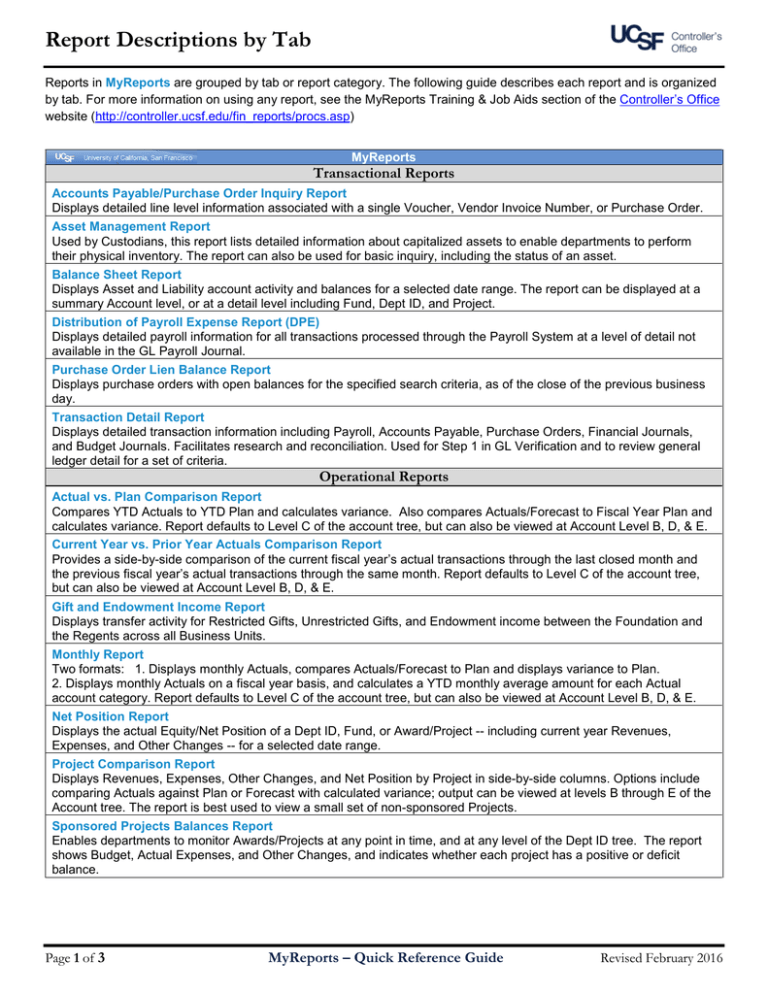
Report Descriptions by Tab Reports in MyReports are grouped by tab or report category. The following guide describes each report and is organized by tab. For more information on using any report, see the MyReports Training & Job Aids section of the Controller’s Office website (http://controller.ucsf.edu/fin_reports/procs.asp) MyReports Transactional Reports Accounts Payable/Purchase Order Inquiry Report Displays detailed line level information associated with a single Voucher, Vendor Invoice Number, or Purchase Order. Asset Management Report Used by Custodians, this report lists detailed information about capitalized assets to enable departments to perform their physical inventory. The report can also be used for basic inquiry, including the status of an asset. Balance Sheet Report Displays Asset and Liability account activity and balances for a selected date range. The report can be displayed at a summary Account level, or at a detail level including Fund, Dept ID, and Project. Distribution of Payroll Expense Report (DPE) Displays detailed payroll information for all transactions processed through the Payroll System at a level of detail not available in the GL Payroll Journal. Purchase Order Lien Balance Report Displays purchase orders with open balances for the specified search criteria, as of the close of the previous business day. Transaction Detail Report Displays detailed transaction information including Payroll, Accounts Payable, Purchase Orders, Financial Journals, and Budget Journals. Facilitates research and reconciliation. Used for Step 1 in GL Verification and to review general ledger detail for a set of criteria. Operational Reports Actual vs. Plan Comparison Report Compares YTD Actuals to YTD Plan and calculates variance. Also compares Actuals/Forecast to Fiscal Year Plan and calculates variance. Report defaults to Level C of the account tree, but can also be viewed at Account Level B, D, & E. Current Year vs. Prior Year Actuals Comparison Report Provides a side-by-side comparison of the current fiscal year’s actual transactions through the last closed month and the previous fiscal year’s actual transactions through the same month. Report defaults to Level C of the account tree, but can also be viewed at Account Level B, D, & E. Gift and Endowment Income Report Displays transfer activity for Restricted Gifts, Unrestricted Gifts, and Endowment income between the Foundation and the Regents across all Business Units. Monthly Report Two formats: 1. Displays monthly Actuals, compares Actuals/Forecast to Plan and displays variance to Plan. 2. Displays monthly Actuals on a fiscal year basis, and calculates a YTD monthly average amount for each Actual account category. Report defaults to Level C of the account tree, but can also be viewed at Account Level B, D, & E. Net Position Report Displays the actual Equity/Net Position of a Dept ID, Fund, or Award/Project -- including current year Revenues, Expenses, and Other Changes -- for a selected date range. Project Comparison Report Displays Revenues, Expenses, Other Changes, and Net Position by Project in side-by-side columns. Options include comparing Actuals against Plan or Forecast with calculated variance; output can be viewed at levels B through E of the Account tree. The report is best used to view a small set of non-sponsored Projects. Sponsored Projects Balances Report Enables departments to monitor Awards/Projects at any point in time, and at any level of the Dept ID tree. The report shows Budget, Actual Expenses, and Other Changes, and indicates whether each project has a positive or deficit balance. Page 1 of 3 MyReports – Quick Reference Guide Revised February 2016 Report Descriptions by Tab MyReports Management Reports Fund Group Report Displays Actual Revenues, Expenses, Other Changes and Net Position by Fund Group (source of funds). Report can be expanded and collapsed up and down the Fund tree (Levels C-E) and the Account tree (Levels B-E) to see data at various levels. Mission Based Report Displays Actual Revenues, Expenses, Other Changes, and Net Position by Mission (Function Code). Report defaults to Level C of the account tree, but can also be viewed at Account Level B, D, & E. Organization Report Compares YTD Actuals against YTD Plan or YTD Forecast and calculates the variance by Department(s) or Department Nodes. Report can be expanded and collapsed up and down the Dept ID tree to see data at all department levels. Report defaults to Level C of the account tree, but can also be viewed at Account Level B, D, & E. Project Use Report Displays Actual Revenues, Expenses, Other Changes, and Net Position by Project Use, an attribute of the Project chartfield, which indicates a specified activity or purpose of the project. Report defaults to Level C of the Account tree, but can also be viewed at Account Level B, D, & E. Fund Group Report Displays Actual Revenues, Expenses, Other Changes and Net Position by Fund Group (source of funds). Report can be expanded and collapsed up and down the Fund tree (Levels C-E) and the Account tree (Levels B-E) to see data at various levels. Faculty Portfolio Reports MyPortfolio Report Displays summary level General Ledger (GL) and projections data for a Faculty and/or Principal Investigator’s (PI) entire portfolio of funds, including project details such as sponsored balances and non-sponsored net position. Award/Parent Summary Report Provides a comprehensive view of sponsored or non-sponsored project activity with summary level General Ledger and Projections data for Project Award/Parent IDs. Faculty Portfolio Monthly Report Displays monthly Actual and Projected financial information for the fiscal year by Project-Activity Period. Sponsored Projects include Budget, Actuals, and Projections. Non-Sponsored Projects include Revenues, Actuals, Expenses, Projections, and Net Position. Payroll Detail by Month Report Displays General Ledger (GL) and projection data for Payroll expenses by month. The report is run for Project–Activity Period. By default, the report displays all payroll elements, such as Gross Pay, Benefits and VLA, but the output can also be filtered to display single elements. Project Summary Report Displays summary level General Ledger (GL) and projection data for the Project chartfield. The report can be run for a single or multiple Projects. Sponsored Awards Summary Report Displays RAS billing and payment information as well as Budget Balance and current fiscal year Net Position by AwardProject-Activity Period. Program Portfolio Report Displays summary level General Ledger (GL) and projections data for programs with projects from multiple PIs and/or multiple Dept IDs. Report filters provide flexibility to define report data and date parameters and include the option to display direct costs only. Portfolio Projections Standard Projections Worksheet enables users to project up to 24-months of budget, expenses, and other changes for Sponsored projects. Projections, (once published) are consolidated into reports with the actual expenditures to provide a projected balance. Extended Projections Worksheet provides the same functionality as standard projections with a rolling 60-month projection period. Non-Sponsored Projections Enables users to project up to 24-months of revenue, expenses, and other changes for Non-Sponsored projects. Projections, (once published) are consolidated into reports with the actual revenue, expenses, and other changes to Revised February 2016 MyReports – Quick Reference Guide Page 2 of 3 Report Descriptions by Tab provide a projected balance. MyReports Control Point Reports SOM Financial Reports Financial Reports developed and maintained by SOM. Access to the reports is administered by SOM and limited to their authorized users. FAS Financial Reports Financial Reports developed and maintained by FAS. Access to the reports is administered by FAS and limited to their authorized users. HR Data Reports Employee Appointment Report Displays HR appointment details in a list format by Employee, Appointment Number, and Appointment Begin and End Date. Employee Distribution Report Displays HR distribution details in a list by Employee, Distribution No., Distribution %, Distribution Chartstring, and Distribution Begin and End Dates. Employee Lookup Report Displays all HR appointment and distribution line information for a single employee, or multiple employees. HR Event Report Displays HR Events such as Appointments and Separations with the ability to drill-through to Event details. Data available from July 2013 forward. HR Monthly Review Report Combines several report subgroups into a single review report with the ability to display New Hires, Separations, Appointments near end, Distributions near end, Probation period near end, Work permit end date, Limited employee hours, and Distributions greater than 100%. Inquiries Inquiry Reports (Controller’s Office Website) Links directly to the Inquiries page of the Controller’s Office Website where users may inquire on any chartfield, combo edits, and many other commonly used codes and values. Extended Projections Worksheet provides the same functionality as standard projections with a rolling 60-month projection period. Non-Sponsored Projections Enables users to project up to 24-months of revenue, expenses, and other changes for Non-Sponsored projects. Projections, (once published) are consolidated into reports with the actual revenue, expenses, and other changes to provide a projected balance. Page 3 of 3 MyReports – Quick Reference Guide Revised February 2016

