Development of a multi-parameter wireless spirometer based on STM32 Chuiliu Zhou
advertisement
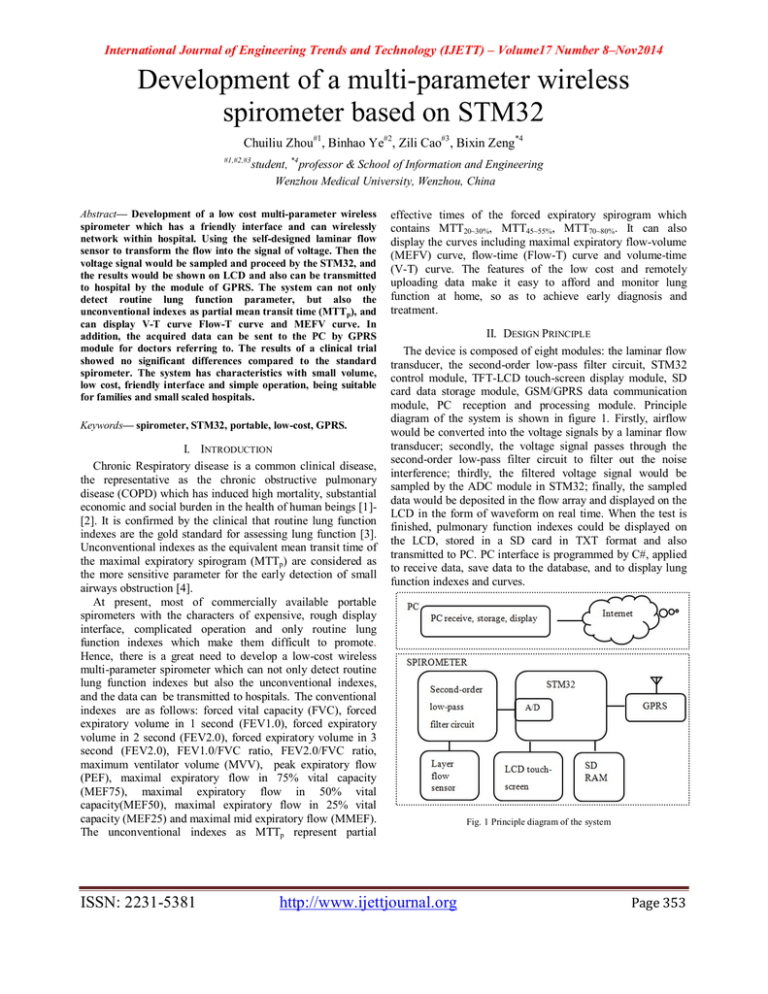
International Journal of Engineering Trends and Technology (IJETT) – Volume17 Number 8–Nov2014 Development of a multi-parameter wireless spirometer based on STM32 Chuiliu Zhou#1, Binhao Ye#2, Zili Cao#3 , Bixin Zeng*4 #1,#2,#3 student, *4 professor & School of Information and Engineering Wenzhou Medical University, Wenzhou, China Abstract— Development of a low cost multi-parameter wireless spirometer which has a friendly interface and can wirelessly network within hospital. Using the self-designed laminar flow sensor to transform the flow into the signal of voltage. Then the voltage signal would be sampled and proceed by the STM32, and the results would be shown on LCD and also can be transmitted to hospital by the module of GPRS. The system can not only detect routine lung function parameter, but also the unconventional indexes as partial mean transit time (MTTp), and can display V-T curve Flow-T curve and MEFV curve. In addition, the acquired data can be sent to the PC by GPRS module for doctors referring to. The results of a clinical trial showed no significant differences compared to the standard spirometer. The system has characteristics with small volume, low cost, friendly interface and simple operation, being suitable for families and small scaled hospitals. Keywords— spirometer, STM32, portable, low-cost, GPRS. I. INTRODUCTION Chronic Respiratory disease is a common clinical disease, the representative as the chronic obstructive pulmonary disease (COPD) which has induced high mortality, substantial economic and social burden in the health of human beings [1][2]. It is confirmed by the clinical that routine lung function indexes are the gold standard for assessing lung function [3]. Unconventional indexes as the equivalent mean transit time of the maximal expiratory spirogram (MTTp) are considered as the more sensitive parameter for the early detection of small airways obstruction [4]. At present, most of commercially available portable spirometers with the characters of expensive, rough display interface, complicated operation and only routine lung function indexes which make them difficult to promote. Hence, there is a great need to develop a low-cost wireless multi-parameter spirometer which can not only detect routine lung function indexes but also the unconventional indexes, and the data can be transmitted to hospitals. The conventional indexes are as follows: forced vital capacity (FVC), forced expiratory volume in 1 second (FEV1.0), forced expiratory volume in 2 second (FEV2.0), forced expiratory volume in 3 second (FEV2.0), FEV1.0/FVC ratio, FEV2.0/FVC ratio, maximum ventilator volume (MVV), peak expiratory flow (PEF), maximal expiratory flow in 75% vital capacity (MEF75), maximal expiratory flow in 50% vital capacity(MEF50), maximal expiratory flow in 25% vital capacity (MEF25) and maximal mid expiratory flow (MMEF). The unconventional indexes as MTTp represent partial ISSN: 2231-5381 effective times of the forced expiratory spirogram which contains MTT20~30%, MTT45~55%, MTT70~80%. It can also display the curves including maximal expiratory flow-volume (MEFV) curve, flow-time (Flow-T) curve and volume-time (V-T) curve. The features of the low cost and remotely uploading data make it easy to afford and monitor lung function at home, so as to achieve early diagnosis and treatment. II. DESIGN PRINCIPLE The device is composed of eight modules: the laminar flow transducer, the second-order low-pass filter circuit, STM32 control module, TFT-LCD touch-screen display module, SD card data storage module, GSM/GPRS data communication module, PC reception and processing module. Principle diagram of the system is shown in figure 1. Firstly, airflow would be converted into the voltage signals by a laminar flow transducer; secondly, the voltage signal passes through the second-order low-pass filter circuit to filter out the noise interference; thirdly, the filtered voltage signal would be sampled by the ADC module in STM32; finally, the sampled data would be deposited in the flow array and displayed on the LCD in the form of waveform on real time. When the test is finished, pulmonary function indexes could be displayed on the LCD, stored in a SD card in TXT format and also transmitted to PC. PC interface is programmed by C#, applied to receive data, save data to the database, and to display lung function indexes and curves. http://www.ijettjournal.org Fig. 1 Principle diagram of the system Page 353 International Journal of Engineering Trends and Technology (IJETT) – Volume17 Number 8–Nov2014 III. HARDWARE CONSTITUTIONS A. Microprocessor The system chooses STM32F103RBT6 processor as the core which is produced by ST and based on ARM Cortex-M3. It is a high 32-bits processor which has the optimal level of power dissipation. The max working frequency is 72MHz and contains 64 I/O ports, 128kB Flash, 20kB SRAM, 7 timers, 12 bits resolution A/D converter, and multi-interfaces, such as CAN interface and SPI interface [5]. B. Laminar flow transducer module Laminar flow transducer is common equipment to measure the flow of respiratory. The principle diagram is shown in figure 2. The main component of the transducer is the laminar body made up by thin corrugated steel plates and common steel plates. The fluid would be made into many trickles passing through the laminar body, and forms Poiseuille flow. chooses the 2.8 inch TFTLCD (Thin Film Transistor-Liquid Crystal Display) embedded with ILI9320 drive display chip and XPT2046 touch control chip to control LCD and touch screen, by means of driving both chips. E. GSM/GPRS module Wireless general packet radio service (GPRS) [7]is a new packet data bearing business developed on the existing GSM system, providing end-to-end connection and wide-area wireless IP connection. This device uses the SIM900A GPRS module, which has advantages of small size, low power consumption and embedded TCP/IP protocol. IV. THE DESIGN OF SOFTWARE A. The interface of spirometer The interface of LCD screen was designed by C language, by means of touching the icon on the LCD to enter the corresponding interface. The diagram of system interface is shown in figure 3. Fig. 2 The model diagram of laminar flow transducer According to the law of Poiseuille [6] Q= (1) where ΔP is the pressure loss, Q is the flow of the gas, R is the diameter of pipe, L is the length of the pipe and η is the dynamic fluid viscosity. It is obviously that the pressure loss is proportional to the flow of fluid through the laminar flow sensor. And thus SM-5852-001-D-1 pressure sensor is used to convert the different pressure on both ends of the laminar to voltage signal. The sensor has the performance of amplification, fully calibration and temperature compensation, which can measure the full range of 0~0.15PSI. The output of voltage signal ranges from 0.50 to 4.5V, where 0.5 to 2.5V is positive pressure and 2.5 to 5.0V is the negative pressure. The output voltage shows a linear relation with the pressure. C. Second order low-pass filter circuit The voltage produced by the pressure sensor mixed with noise interference, considering the person's breathing frequency is in the range of 0.2~35Hz, so the second order butterworth low-pass filter circuit would be used to filter the interference signal of higher than 35Hz. Since the supply voltage is +5V, but the amplifier OP07D rated working voltage is ±5~±15V, so the MAX232 could be used to convert +5V to ±10V for the use of OP07D amplifier. D. TFT-LCD Touch-screen display module Since STM32 is lack of internal integration dedicated interface of LCD and touch screen control, this system ISSN: 2231-5381 Fig. 3 Diagram of system interface The user interface comprises forced expiratory testing, MVV testing, parameter display and wireless uploading. Forced expiratory test controls: sampling flow data, at the same time displaying flow-time curve on LCD in real time. When test is finished, the corresponding indexes would be calculated. MVV testing controls: sampling the flow date and displaying flow-time curve on LCD in real time. The MVV parameter would be calculated after 15s of flow data collection. Wireless uploading: the GPRS module would be initialized and flow data were sent to the PC by GPRS module. Parameter display controls: routine lung function indexes and unconventional indexes would be displayed on LCD; Curve display controls: the curves of MEFV, Flow-T, and V-T would be displayed. B. Sampling This research uses the method of average filtering, calculating the average data to be saved to the flow array at intervals of sampling several data. In order to ensure that the data sampled is valid, it is critical to verdict the start and end points of the test, by setting the threshold of flow to exclude outside interference. When the flow exceeds the set threshold, it begins to save the data, turn on the timer and sample flow http://www.ijettjournal.org Page 354 International Journal of Engineering Trends and Technology (IJETT) – Volume17 Number 8–Nov2014 data at frequency of 200Hz. When the time exceeds 1s and flow lower than the set threshold, the test terminated. C. The algorithm of lung function indexes (1)The calculation of routine pulmonary function indexes: FVC is integral of the forced expiratory flow, and the expression is: , (2) where N is the number of samples, Δt is the interval of samples, flow(k) is the flow of the k-th sample. MVV: sampling flow data and accumulating until time reaches 15s. FEV1.0: sampling and accumulating the current flow, saving the value when timer reaches the time of 1s. In a similar method can be used to obtain FEV2.0, FEV3.0, FEV1.0/FVC ratio and FEV2.0/FVC ratio. PEF: searching the maximum flow in the saved array. MEF75: Searching the element which is the closest to 25% of FVC in the total flow array and recording its index number, by means of extracting the index number from the corresponding element in flow array. In a similar way, we can obtain MEF50, MEF25 and MMEF. (2)MTTp is based on the Jordanoglou’s theory in which each 10% FVC segment of the FVC-t curve can be considered as the principle of linear, the equations [3, 8] MTT20~30%= MTT45~55%= Fig. 5 The diagram of GPRS data communication V. EXPERIMENT A. Pressure and flow calibration The sensor was calibrated by the devices of air compressor and rotameter, and we find an approximate linear relationship between pressure and flow rate, as expected. (3) MTT70~80%= (3) Depicted the MEFV curve, V-T curve and Flow-T curve on the LCD screen, the interfaces are shown in Figure 4. MEFV Flow-T V-T Fig. 6 The relationship of flow-voltage Fig. 4 The curves of MEFV, V-T and Flow-T The collected flow data and the total flow data are stored in the arrays, then transformed to the corresponding 320×240 points of LCD and called the functions to connect the points. D. GPRS data communications and PC display In the platform of Matlab, the function of least squares method polyfit() is to assess and fit data. The obtained curve was y=0.0082+4.7361*x. Then the function of regress() inspects the established linear regression mathematical model, and finally the obtained equation was y=0.0239+4.7675*x, shown in figure 6. Using 3-L syringe for calibration, as a result the error was 2.7%, conformed to the requirements of the American Thoracic Society (ATS). This part is composed of the data sent via GPRS, PC receive, and interface display. The platform of C# and SQL database was used to achieve the communication to microcontroller and save the acquired data, display lung function indexes and curves. The diagram of GPRS data communication is shown in figure 5. Touch screen Laminar flow sensor Fig. 7 The prototype of Pulmonary ISSN: 2231-5381 http://www.ijettjournal.org Page 355 International Journal of Engineering Trends and Technology (IJETT) – Volume17 Number 8–Nov2014 B. Validity analysis of low-cost spirometer Validity was evaluated by testing 15 cases of subjects (10 males and 5 females, aged from 20 to 30 years, 24 years average) under the guidance of technicians in both low-cost spirometer (shown in Figure 7) and standard spirometer (German Jaeger MasterScreen Diffusion). Subjects were tested three times on both spirometers, and fetched the best of them. The obtained data would be proceeded to correlation analysis and paired t test with the help of statistical software SPSS19.0, thus the results would be expressed by the correlation coefficient(r) and the mean±SD. The results are shown in Table 1.r≥0.9 indicating a high degree of correlation, and P>0.05 indicating no significant difference. TABLE I COMPARE 15 SUBJECTS DATA ON THE TWO SPIROMETER AND MTTP TEST parameter FVC(L) FEV1(L) PEF(L) MMEF(L) MEF75(L) MEF50(L) MTT20%~30%(s) MTT45%~55%(s) MTT70%~80%(s) Low-cost spirometer 3.63±0.77 3.22±0.69 7.13±1.90 3.72±0.79 6.42±2.26 5.16±1.24 0.2847±0.1215 0.4133±0.1363 0.8080±0.2484 Jaeger r p 3.68±0.88 3.26±0.73 7.32±2.41 3.90±1.03 6.61±2.54 5.13±1.21 0.97 0.964 0.752 0.91 0.873 0.511 0.455 0.557 0.651 0.154 0.569 0.926 The table shows that the results obtained from the two spirometer are not different significantly (p>0.05), and most of the correlation coefficients are greater than 0.9, in spite of the value of PEF, MEF75 and MEF50 less than 0.9. As for the same patient measured on different type of spirometer, it is normal for some deviations. Overall, in this research the lowcost spirometer performed a good accuracy and reliability. VI. CONCLUSIONS The spirometer is accurate with the error of lower than ±2.7%, in line with ATS standard. The results show no significant differences comparing the two spirometers. The low-cost spirometer can not only test routine pulmonary function indexes, but also the unconventional indexes as MTTp and display volume-time curve, flow-time curve and flow-volume curve. In addition, as the friendly UI interface is provided with visual operation, the device would be used easily. Furthermore, for the capability of remote transmission, it would be provided with online interaction between the patient at home and the hospital for a suitable follow-up of his or her disease. This application keeps with the current trend in providing health care at the patient’s home. It could be convenient and economical for the patients who have long-term trouble with chronic respiratory disease for the daily monitoring of variability in airway obstruction and adjusting the treatment accordingly. Moreover with its compact and cheap features, it is suitable for promotion to the household and small scaled hospitals. ISSN: 2231-5381 REFERENCES [1] [2] [3] [4] [5] [6] [7] [8] Xiaocong Fang, Xiangdong Wang, Chunxue Bai, “COPD in China The Burden and Importance of Proper Management,” CHEST, vol. 139(4), pp. 920–929, Apr. 2011. Rietveld S, ”Habituation to prolonged airflow obstruction,” Asthma, vol. 34(2), pp. 133-139, 1997. Soriano JB, Zielinski J, Price D, “Screening for and early detection of chronic obstructive pulmonary disease,” The Lancet., vol. 374(9691), pp.721-732, Aug. 2009. Kirby, B.J, Micro and Nanoscale Fluid Mechanics: Transport in Microfluidic Devices, Cambridge University Press, Aug. 2013. STM32 Reference Manual (RM0008), STMicroelectronics, 2013. Jordanoglou J, Tatsis G, Veslemes M et al, “Partial effective times of the forced expiratory spirogram in health and mild airways obstruction,” THORAX, vol. 35(5), pp. 375-383, 1980. Available [online]: http://en.wikipedia.org/wiki/ General_Packet_Radio_Service. Guifang Huang, Jiahao Li, “Determination and application of MTTp in normal persons and COPD patients with “convenient calculation”,” West China Medical Journal, vol. 6 (2), pp. 142-146, 1991. VII. AUTHOR DETAILS Chuiliu Zhou, first author, pursuing medical instruments, Department of Biomedical Engineering. Bixin Zeng,corresponding author, working as a Professor from Department of Biomedical Engineering in Wenzhou Medical University , Wenzhou, China. Her main research direction is medical signal detection and processing. She has experience in teaching field more than 20 years. http://www.ijettjournal.org Page 356
