Online Rouge Monitoring: A Science- Based Technology to Measure Rouge Rates
Reprinted from
PHARMACEUTICAL ENGINEERING
®
The Official Magazine of ISPE www.ISPE.org
November/December 2011, Vol. 31 No. 6
©Copyright ISPE 2011
This article presents the implementation and installation of an online rouge monitor which measures in near realtime the rouge rate and rouge accumulation
(metal loss) over time helping to determine derouging and passivation frequency based on empirical data.
Online Rouge Monitoring: A Science-
Based Technology to Measure Rouge
Rates by Nissan Cohen and Allan Perkins
R
Introduction
ouge is a common phenomenon found in pharmaceutical hot water and steam systems. The use of SS 316L, in the pharmaceutical industry waters at or above 65°C, has enhanced the proliferation of rouge contaminated systems. The primary constituents of rouge are various iron oxides and hydroxides; however, rouge also may contain chromium, nickel, and molybdenum oxides.
While the discoloration of SS 316L piping, accessories, and vessels due to rouge deposition is not a problem in itself, any contamination of the product from the rouge is a problem.
Numerous strategies have been implemented to derouge and passivate a pharmaceutical water system. Although many QC/QA personnel find the rouge unsightly, there is little understanding of the rouging process, including its migration in the water system, why and how certain areas are affected by rouge deposition and others are not, or the impact on the final product. Current methodologies for determining the frequency of derouging and passivation are non-scientific assessments based on subjective online rouge monitoring determinations of the QC/QA personnel in the absence of an objective measurement technique.
Decisions are made having economic impact without objective data.
Pharmaceutical water systems are 24/7 continuous operations. The introduction of an online rouge monitor with real-time measurements of rouge rate and resultant rouge accumulation can be an invaluable tool to the operation and maintenance of a hot pharmaceutical water system, providing a scientific validation and real-time assessment of derouging and passivation frequencies.
Background
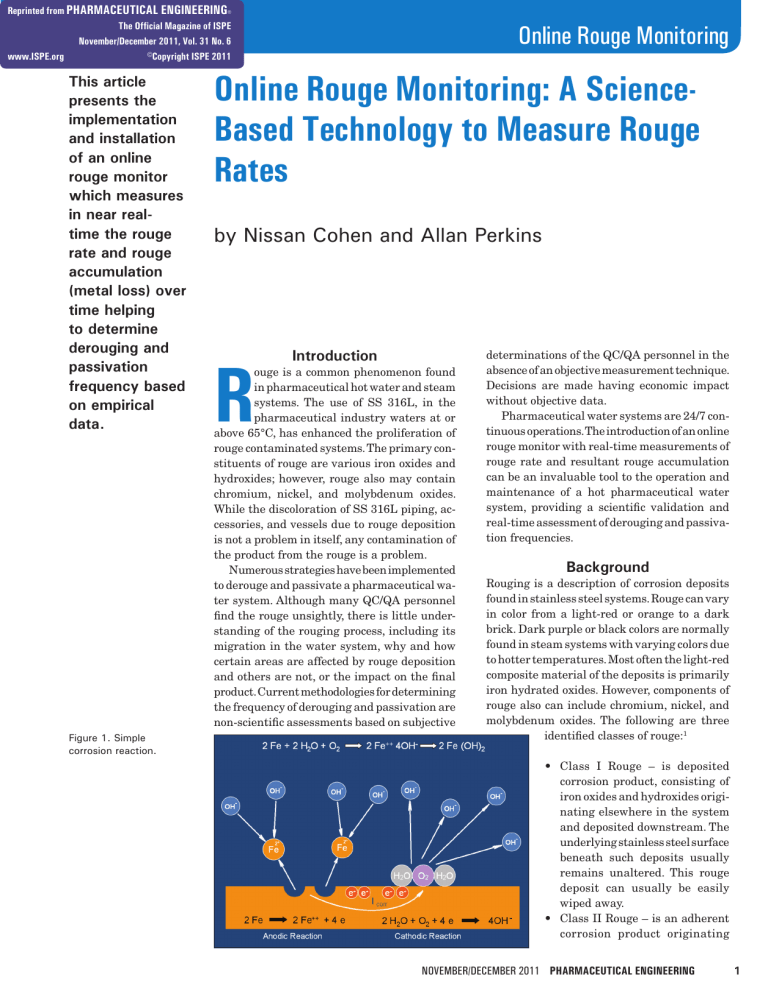
Rouging is a description of corrosion deposits found in stainless steel systems. Rouge can vary in color from a light-red or orange to a dark brick. Dark purple or black colors are normally found in steam systems with varying colors due to hotter temperatures. Most often the light-red composite material of the deposits is primarily iron hydrated oxides. However, components of rouge also can include chromium, nickel, and molybdenum oxides. The following are three identified classes of rouge: 1 Figure 1. Simple corrosion reaction.
• Class I Rouge – is deposited corrosion product, consisting of iron oxides and hydroxides originating elsewhere in the system and deposited downstream. The underlying stainless steel surface beneath such deposits usually remains unaltered. This rouge deposit can usually be easily wiped away.
• Class II Rouge – is an adherent corrosion product originating
November/December 2011 PHARMACEUTICAL ENGINEERING 1
online rouge monitoring
in-situ on unpassivated or improperly passivated stainless steel surfaces. By its formation, the normally passive protective film on the stainless steel surface is altered.
• Class III Rouge – is a blue or black, mostly iron oxide corrosion product, commonly called magnetite, which forms on surfaces in high temperature steam systems. On electropolished surfaces, corrosion deposit may be glossy black, stable, and adherent. On unpassivated mechanically polished surfaces, the corrosion deposit may be powdery black and may slough off.
2
Non-adherent rouge corrosion products (Class I) may deposit in numerous locations in a high purity water system and are not limited to only stainless steel surfaces. Non-metallic surfaces of Teflon, ETFE, PTFE, and other derivatives seem to attract migrant rouge particulates.
2,3,4 Some non-metallic surfaces have an affinity for rouge deposition, which may be due to physical electrostatic properties.
4
Rouge is a corrosion product. Corrosion is an electrochemical process. A simple corrosion reaction of iron in water is shown below.
2 Fe + 2 H
2
O + O
2
→ 2 Fe + + 4OH – → 2 Fe (OH)
2
Iron in the presence of water and oxygen yields ferrous hydrox ide which may subsequently be oxidized to ferric hydroxide.
The total corrosion reaction is broken into two components, the anodic and the cathodic parts of the reaction - Figure 1. Metal ions from the anode release electrons. These electrons move as the corrosion current (I corr
) to the adjacent cathodic areas where a cathodic reaction occurs. Several cathodic reactions can occur, but there is no metal lost from the cathode. If we could measure the electron flow i corr
, then we could measure the amount of metal ions going into solution using Faraday’s laws and thus the corrosion rate.
5 In reality, we have to mea sure this current indirectly. This is done by applying a small potential between two electrodes (2 Δ E) and measuring the resultant current that flows (i meas
) between the two electrodes.
As the corrosion rate increases, i meas
increases.
5,6
The relationship between the externally measured current
(i meas
), the corrosion current (i corr
), and the externally applied potential across a single corrosion interface ( Δ E) was first derived by Stern and Geary in the January 1957 edition of
The Journal of the Electrochemical Society.
7 i corr b a
2.303(b b a c
+ b c i meas b a b
) Δ E 2.303(b a c
+ b c
1
) R p
Where:
b a
= Empirically determined anodic Tafel Slope
b c
= Empirically determined cathodic Tafel Slope
R p
= The Polarization Resistance of the Corrosion Inter face
Rouge is corrosion and corrosion rates of metal alloys in water systems, in a wide range of industries, have been successfully
PHARMACEUTICAL ENGINEERING November/December 2011
Figure 2. Rouge monitor two electrode probe.
measured by standard electrochemical methods for more than 50 years. These water systems include cooling waters, process waters, potable waters, boiler waters, aqueous chemical processes, food processes, and pulp and paper processes.
The main differences between these applications and those in the pharmaceutical industry are the low corrosion rates and the low conductivity of the water in the pharmaceutical industry.
This electrochemical technology, its theory, applications, limitations, and interferences are covered in ASTM G96 –
90(2008) Standard Guide for Online Monitoring of Corrosion in Plant Equipment (Electrical and Electrochemical Methods).
6
The method for computing corrosion rates from electrochemical measurements are covered in ASTM G102 – 89(2010)
Standard Practice for Calculation of Corrosion Rates and
Related Information from Electrochemical Measurements.
5
The conversion of the electrochemical currents that are measured at the metal water interface are converted into corrosion rates, as described in the above standards, through constants and empirically determined values, called Tafel slopes. The Tafel values depend on the mechanisms controlling the movement of ions at the metal water interface, such as charge transfer, diffusion control, and transport of metal ions in oxide films. Normally, these Tafel values can be determined empirically. The overall correlation of corrosion rates can be made by comparing the metal loss over time on the measurement electrodes or similar pieces of material. In very low corrosion rates and very low conductivity of high purity waters used in the pharmaceutical industry, Tafel values are difficult to measure. Correlation of corrosion rates and actual metal loss also can be difficult to gauge at levels of a few nanometers per month. Sensitivity of the electronics enhances the measurement, stability, and performance of the instrumentation at very low nanometers/month levels.
Although correlation of measured corrosion rates to actual corrosion rates is difficult in low conductivity, low corrosion rate waters, the Tafel values for any particular set of operating conditions are usually relatively constant. Consequently, a doubling of the measured corrosion rate will correspond to a doubling of the actual corrosion rate. Generally, the change in corrosion rate is much more important than the absolute magnitude of the corrosion rates. The aim of monitoring is to determine the incidences of high and low corrosion rates, and the operating conditions that correspond to each. It is possible to identify and minimize the time for high corrosion
Figure 3. Components of equivalent circuit.
rate conditions, identify these conditions, and maximize the time for low corrosion rate conditions. These conditions can have a major impact on the resultant corrosion rate and metal loss affecting the pharmaceutical water rouging rate.
The ASTM Standard Guide G966 depicts an equivalent electrical circuit that represents the metal/water corroding interface of a typical electrochemical corrosion probe. If the values that are applicable to stainless steel in ultrapure water at 4.65 Megohm-cm water, corroding at 10 nanometers per month, the components of that equivalent circuit are shown in Figure 3.
In this case, Rp would be 1 Megohm, and Rs would be
511Kohms. The value of Cdl might typically be about 100 microfarads. Since the maximum potential that can be applied for theoretical validity of the measurement is about 20 mV between the electrodes, the measured currents are around 8 nanoamps. At a resolution of 1 nanometer/month, this means a resolution of 800 picoamps, which is a very sensitive measurement to make in a field application.
Due to the very small currents to be measured, high input impedances must be maintained to prevent leakage currents.
In addition, special measurements are required to determine the value of the solution resistance Rs to subtract from the total resistance in order to determine the required value of Rp.
Rp is inversely proportional to corrosion or rouge rate. High rates of rouge, such as 400 nanometers/month, are difficult to measure because Rp becomes very small compared to Rs.
Fortunately, it appears that most rouge rates, in pharmaceutical waters, are in the single digits of nanometers/month with excursions typically not higher than a few tens of nanometers per month.
Calibration tests on the rouge monitors used in this study show an accuracy and repeatability of better than 1 nanometer/month has been achieved as measured on the equivalent circuits for rouge rates of 0 to 400 nanometers/month in 4.65
Megohm-cm water. This indicates that a high performance instrument is capable of measuring the low rates of corrosion, or rouging, of stainless steel in ultrapure water. Laboratory and field trials are on-going to further prove the performance and investigate the causes of change in the rouging rate in high purity and ultrapure water.
Industry Wants and Needs
Derouging and repassivation frequencies are based on either time duration or on a visual inspection of the piping or vessels.
Since no accurate method or technology has been employed to measure rouge, QA/QC personnel were obligated to use online rouge monitoring subjective influences to determine derouging and passivation frequencies. Thus, SOPs were developed to derouge and repassivate based on time duration, i.e., annually, biannually, every six months, every scheduled shutdown, etc., which was based on QA/QC risk comfort levels. Pharmaceutical companies routinely perform preventative measures to ensure compliance to SOPs even if the procedure may not be warranted. Derouging and repassivation may be a prime example of this.
An accurate measurement method for corrosion or rouging rate will help determine the operating limits before derouging and re-passivation are required and offer greater insight into the rouge formation process. Rouge formation is a steady process in all metallic piping systems, but is exacerbated by high temperature and metal composition.
8
Measuring the rouge rate can help determine the rouge levels of the system and may help determine the probable concentration of rouge in the final product. Changes in the rouge rate may result from operational influences of flow, points of use, pressure, oscillations in water temperatures, and supply or make-up issues.
Modern pharmaceutical water systems are completely automated and computer controlled. Many online instruments have replaced or augmented laboratory testing.
9
Online instruments can be used for real-time release.
10 The integration of an online rouge monitor within the existing network of instruments and computers on the water system is preferable for analysis and correlation with other process data, while adherence to 21 CFR part 11 is maintained.
Derouging and Passivation Economics
Derouging and passivation are different processes, but require similar procedures. Etching chemicals are needed to remove the rouge from the base metal. Once the metal is clean of rouge, the re-passivation of the metal surface can follow.
Typically, phosphoric, citric, nitric, and other acids are used for derouging and passivation. Acids are used to remove rouge and passivate, while caustics of NaOH or NH
2
OH are used to neutralize the acids before disposal. Disposal is usually via the sewer and drain system, but in certain cases onsite wastewater treatment facilities are used. The rinsing the system of all residues is paramount before the water system can be reactivated for production. Any residual chemicals in the system can and will upset the water chemistry limits.
A typical derouging and passivation shutdown can last from two to seven days depending on how many loops need to be processed and the breadth of the system.
Below are calculations for the derouging and passivation costs of a pharmaceutical water system. This water system has a 20 GPM (76 LPM) USP Purified loop with feed to a 4
GPM (15 LPM) distillation unit, serving a 10 GPM (38 LPM) recirculating WFI hot water loop at 85°C with storage. All piping is 2" (50 mm) and the total piping for all loops com bined is 1,000 feet (300 meters).
11
The derouging and passivation costs for the distillation unit,
USP purified, and WFI water loops and storage is $30,000, priced by a derouging/passivation service organization. This includes all chemicals, neutralization, and third-party labor.
November/December 2011 PHARMACEUTICAL ENGINEERING 3
online rouge monitoring
Additional costs to be added to the $30,000 figure are down time of production in days, client’s labor, and non-production of products over the shutdown time period. Since each product produced has a different retail and cost value, the final figure can be quite different between manufacturers. A very conservative estimation is a total of $50,000 for all costs. Larger systems with more loops, more expensive downtime calculations, and more expensive products can increase the costs to many hundreds of thousands of dollars per treatment.
The economic issues are calculable, but the overriding consideration is how often is derouging and repassivation currently performed and why? Due to the unavailability of exact rouge rate and accumulation measurements, common assessments are based on either historical trending of other instruments or subjective assessments of coloration. At no time was an assessment performed to determine if rouge had actually been assayed in the final product. The monetary investment in derouging and passivation is high. The delay of an unnecessary derouging and passivation treatment could save tens of thousands to hundreds of thousands of dollars per year per site.
Field Application of the Rouge Monitor
The online rouge monitor comprises front end probe/transmitter, remote display unit, data logger, and analog retransmission unit - Figure 4. The analog outputs are connected directly to the DCS, SCADA, BMS, or process control system, while the on-board data logger enables independent data accumulation with direct data transfer to a computer. The display unit provides power and RS 485 digital communication to the sensing probe and transmitter enabling the display unit to be mounted up to 4,000 feet from the probe/transmitter.
The unit displays values of rouge rate in nanometers/month or microns/month, and rouge accumulation or metal loss in nanometers or microns.
Corrosion or rouge rates are rarely uniform. Previous studies have shown that some active points for rouge may include pumps and spray balls.
12 Theories abound, but devices such as pump impellers, spray balls, and flow restrictors may have velocity related actions causing erosion of the passive
Figure 4. Configuration of the rouge monitor.
layer. Base metal will corrode easily without the passivation layer.
The installation of a rouge monitor closely downstream from the pumps was chosen to pick the higher turbulent areas of the flow where erosion may be greater. Additionally, a second rouge monitor was installed on the return loop before discharge into the WFI storage tank. The rouge monitor configuration and location in the system is shown in Figure
5.
The online rouge monitor was installed on the secondary loop WFI water system that is used for lab testing and small batch production, where water usage is variable. The lower graph in blue denotes the “Rouge Rate.” In Figure 6, initially, the new electro-polished SS316L probe electrodes showed a high initial corrosion or rouge rate of more than
50 nanometers per month exponentially decreasing over 24 hours before stabilizing at a low level of 1 to 3 nanometers per month in the WFI water. From there, until 7 February, the rate increased slowly from 1 to 3 nm/month to 3 to 5 nm/ month.
Figure 7, expanding the view of data for 6 February to 8
February, shows the values of rouge rate of around 3 to 5 nm/ month. Notice, at around 11:00 AM on 8 February, the rouge rate drops precipitously to 1 nm/month and remains at that level for the successive readings. Shortly after 11:00 on 8
February, the points of use were opened for a new fill line. The rouge rate changed due to the operational characteristics of the hot WFI water system. When the water was recirculating,
4
Figure 5. Recommended location of rouge probes in the water system.
PHARMACEUTICAL ENGINEERING November/December 2011
Figure 6. Rouge rate (in blue) and rougeaccumulation over time (in red) in a WFI variable flow filling operation.
online rouge monitoring
Figure 7. Zoom of data in previous displayed Figure 6.
with minimal usage, the rouge rate built up to a 5 nm/month level. As the use points were opened, the decreased residence time of the water in the recirculating piping system showed a dramatic reduction in rouge rate.
In general, from mid February to mid March there were significant rate fluctuations with occasional excursions up to
20 to 25 nm/month with patterns that are clearly related to process changes. For example, on 9 March there is a sharp increase up to 20 to 25 nm/month in Figure 8 for several readings before settling back to a constant 3 nm/month with additional fluctuations two days later. Similar patterns occurred on 23 February to 27 February and on 27 February to 28 February. The fluctuations are examples of operational changes in the water system due to flow, velocity, use point usage, temperature, and recirculation.
Certain conditions are needed for rouge to develop. There is no science on what these conditions may be, only speculation. Theories abound about rouge development due to the subtle metal composition differences of SS316L, temperature levels, chromium, molybdenum and nickel percentages, carbon dioxide saturation, and other possibilities.
13 There is no proven theory and there is a possibility that some or all of these influences may have a causal affect.
4 The online rouge monitor is a unique instrument providing “Rouge Rate” measurements with accuracy down to single digit nanometer/month levels.
The measurement of very low level rouge rate and metal loss in WFI water systems should not be surprising. The water has been previously treated by advanced purification train components of reverse osmosis, ion exchange, and distillation.
These process steps are to remove various impurities in the water. Since the rouge is an end product of corrosion and typified in hot water systems, the source of the rouge is contained in the piping and vessels downstream of the purification train components. The very small and trace amounts of rouge in the water does not appreciably affect the conductivity of the water. Measuring the presence of rouge with conductivity alone is not a discreet detection of rouge in the water as other materials, primarily gases, in the water are contributing to the major conductivity shifts until equilibrium is attained.
The graph data shows extremely minute traces of rouge and very small accumulation over time. The minute concentrations of rouge in the water provide data of the possible concentration of rouge that might be found in the final product.
Figure. 8. Detail of graphed excursions of rouge rate between
February 20 and March 13.
Laboratory analysis would need extremely small detection limits to determine if rouge was found in the final product.
Many previously unanswered questions can be answered with real data and operational characteristics. Example: What accumulation depth or rouge rate is considered acceptable and how is this determined? What is the accumulation over any given time period? When will a rouge accumulation/deposition of X, Y, or Z be accumulated? The rouge rate and rouge accumulation data will help determine the limits before a derouging or passivation treatment is needed. If the current rouge rate is 3 to 5 nm/month and the accumulation is just more than say 20 nm to date, it may still take years before a user-assigned limit is reached to initiate derouging and passivation. If the previous protocol was to derouge and passivate annually and now the treatment can be delayed two or three years, due to the data, what are the savings to water system owner?
Further field experience with the rouge rate data and related process conditions will help define operational practices to avoid breakdown of passivation layers and exposure of base metals. It will allow a better understanding of water chemistry deviations, and velocity erosion effects. Continuous
24/7 operations need real-time measurements to maintain operational consistency within proscribed limits guaranteeing quality products.
Future analysis and a follow-up article will be written to assess the long-term operation of a rouge monitor and investigate changes in rouge rates and metal loss over long periods of operation. These long-term analyses will help define the viability of passivation treatments, passivation durability, derouging frequency, and definitive cost savings for a monitored system.
Conclusions
The use of an online rouge monitor can measure actual rouge rates and metal loss over any time period allowing userdefined limits to be substantiated with empirical data. The determination of derouging and passivation are then based on user-assigned limits and not based on a subjective time period set by the QC/QA Department. The rouge rate may help determine the probable concentration of rouge in the final product. Most significantly, optimization of derouging and passivation treatment frequency could save tens of thousands
November/December 2011 PHARMACEUTICAL ENGINEERING 5
6 online rouge monitoring to hundreds of thousands of dollars per site annually with scientific data and justification.
References
1. Tverberg, J. C., and Ledden, J. A., “Rouging of Stainless
Steel in WFI and High Purity Water Systems,” Proceed ings of Tube 2000, Dusseldorf, 2000.
2. Banes, P. H., “Materials – Fundamentals of Passivation in Water Systems,” Ultrapure Water, April 1998.
3. Mathiesen, Troels, Rau, Jan, Frantsen, Jan E., Terava,
Jorma, Bjornstedt, Per-Ake, Henkel, Benedikt; “Using
Exposure Tests to Examine Rouging of Stainless Steel,”
Pharmaceutical Engineering, July/August 2002, Vol. 22,
No.4.
4. Mathiesen, Troels, Frantsen, Jan Elkjaer, “Rouging of
Stainless Steel Systems – Examples and Present Un derstanding,” presented at NACE Corrosion 2007, paper
07193, Nashville TN, USA, 2007.
5. ASTM G102 (Latest Revision) – Standard Practice for
Calculation of Corrosion Rates and related information from Electrochemical Measurements.
6. ASTM G96 (Latest Revision) – Standard Guide for On-line
Monitoring of Corrosion in Plant Equipment (Electrical and Electrochemical Methods).
7. Stern, M., Geary, A.L., “A Theoretical Analysis of the Shape of Polarization Curves,” Journal of the Electrochemical
Society, January 1957.
8. ISPE Critical Utilities D/A/CH COP, “Rouge in Phar maceutical Water and Steam Systems,” Pharmaceutical
Engineering, July/August 2009, Vol. 29, No. 4, pp. 48-55.
9. United States Pharmacoepia 29, <643> and <645>, Rock ville, MD.
10. Godec, Richard, Cohen, Nissan, “Automated Release of
Water Using On-line TOC Analysis and FDA Risk-Based cGMP, Inspection, and PAT Principles,” Pharmaceutical
Engineering, January/February 2005, Vol. 25, No.1.
11. System design provided by GMP Systems, Fairfield, NJ.
12. Honeyman, Rouge in Pharmaceutical Water Systems, http://www.honeyman.co.uk/downloads/html/rougepharmaceutical-water-systems.html
13. Coleman, D.C., Evans R.W., “Corrosion Investigation of 316L Stainless Steel Pharmaceutical WFI Systems,”
Pharmaceutical Engineering, Volume 11, Number 4, 1991 pp 9-13.
About the Authors
Nissan Cohen is a worldwide expert in
Total Organic Carbon (TOC) and in high purity, ultrapure, reclaim, and recycle water systems with expertise in instrumentation, automation, and organic contamination oxidation systems using ozone, UV, ion exchange, and catalysts. He is an accomplished writer of more than 30 technical articles published in Ultrapure Water, A2C2, Pharmaceutical Technology,
Pharmaceutical Engineering, Semiconductor International, and the Journal of the Institute of Environmental Sciences
and Technology. He has been nominated twice for Pharmaceutical Engineering’s “Article of the Year.” Cohen has been a contributing author to the ISPE Baseline Guide for Water and Steam Systems and the ISPE Good Practice Guide on
Commissioning and Qualification for Pharmaceutical Water and Steam Systems. He is a member of ISPE, Technical Editor of the Journal of the Institute of Environmental and Science
Technology (IEST), Technical Reviewer of Pharmaceutical
Engineering , Chairman of the ISPE Water and Steam Fo rum, Founder/Chair of the ISPE Discussion Forums, former member of the Technical Advisory Board of A2C2 magazine.
Cohen was a contestant on Jeopardy! that aired on 14 April
2006. His education includes a degree in agriculture and genetics from the University of Wisconsin and Ruppin Institute.
Cohen is bilingual in English and Hebrew and has working knowledge of five additional languages. He is a member of
International Standards Committees: ASTM E-55, IEST
(WG 14644 Contamination Control), ASTM D-19.03, as well as ISPE Steering Committee member for the ISPE Critical
Utilities COP. Cohen is the former Chairman of several ISPE
Committees, including Membership Services, Publications,
Pharmaceutical Engineering and Website, and several ISPE
COPs, including HVAC and PAT. He is currently a member of North American Chapter Council.
Rohrback Cosasco Systems, 11841 E. Smith Ave., Santa
Fe Springs, California 90670 USA.
Allan Perkins is the Product Manager for
Rohrback Cosasco Systems, the world’s leading supplier of corrosion monitoring equipment. He holds a first class Honors degree in mechanical engineering and Masters in engineering design. He is the NACE Task
Group Chairman that prepared the Stateof-the-Art report 3T199 for Assessment of
Corrosion in Field Applications. He is the ASTM Committee
Chairman for Standard Guide G96 On-Line Monitoring of
Corrosion in Plant Equipment. Perkins was educated in the UK and spent 10 years in the UK power plant industry and 10 years in instrumentation before moving to the US in 1982 to join COSASCO, which merged with Rohrback in
1984. He is currently responsible for systems and product development.
Rohrback Cosasco Systems, 11841 E. Smith Ave., Santa
Fe Springs, California 90670 USA.
PHARMACEUTICAL ENGINEERING November/December 2011

