PERFORMANCE MANAGEMENT (QUARTERLY REPORT AS AT 31st December 2010) Appendix N Indicator Name
advertisement
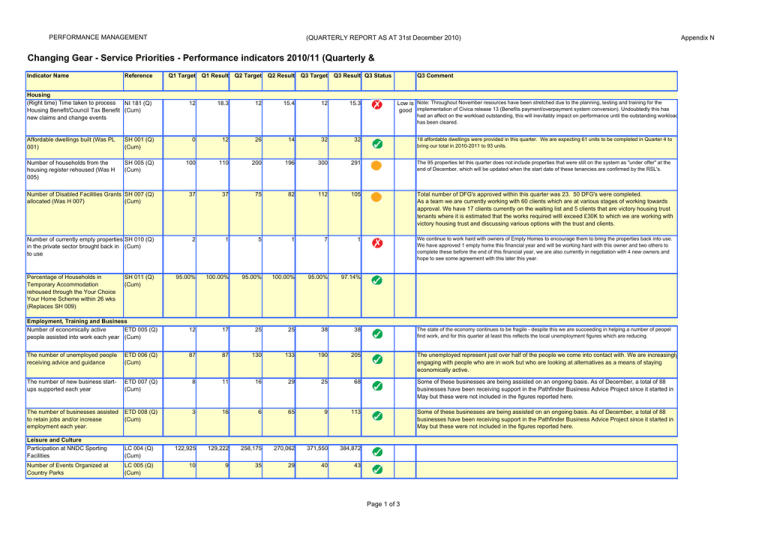
PERFORMANCE MANAGEMENT (QUARTERLY REPORT AS AT 31st December 2010) Changing Gear - Service Priorities - Performance indicators 2010/11 (Quarterly & Indicator Name Reference Housing (Right time) Time taken to process NI 181 (Q) Housing Benefit/Council Tax Benefit (Cum) new claims and change events Q1 Target Q1 Result Q2 Target Q2 Result Q3 Target 12 18.3 12 15.4 12 Q3 Result Q3 Status 15.3 Q3 Comment Low is Note: Throughout November resources have been stretched due to the planning, testing and training for the good implementation of Civica release 13 (Benefits payment/overpayment system conversion). Undoubtedly this has had an affect on the workload outstanding, this will inevitably impact on performance until the outstanding workload has been cleared. Affordable dwellings built (Was PL 001) SH 001 (Q) (Cum) 0 12 26 14 32 32 18 affordable dwellings were provided in this quarter. We are expecting 61 units to be completed in Quarter 4 to bring our total in 2010-2011 to 93 units. Number of households from the housing register rehoused (Was H 005) SH 005 (Q) (Cum) 100 110 200 196 300 291 The 95 properties let this quarter does not include properties that were still on the system as "under offer" at the end of December, which will be updated when the start date of these tenancies are confirmed by the RSL's. Number of Disabled Facilities Grants SH 007 (Q) allocated (Was H 007) (Cum) 37 37 75 82 112 105 Total number of DFG's approved within this quarter was 23. 50 DFG's were completed. As a team we are currently working with 60 clients which are at various stages of working towards approval. We have 17 clients currently on the waiting list and 5 clients that are victory housing trust tenants where it is estimated that the works required willl exceed £30K to which we are working with victory housing trust and discussing various options with the trust and clients. Number of currently empty properties SH 010 (Q) in the private sector brought back in (Cum) to use 2 1 5 1 7 1 We continue to work hard with owners of Empty Homes to encourage them to bring the properties back into use. We have approved 1 empty home this financial year and will be working hard with this owner and two others to complete these before the end of this financial year, we are also currently in negotiation with 4 new owners and hope to see some agreement with this later this year. SH 011 (Q) (Cum) 95.00% 100.00% 95.00% 100.00% 95.00% 97.14% 12 17 25 25 38 38 Percentage of Households in Temporary Accommodation rehoused through the Your Choice Your Home Scheme within 26 wks (Replaces SH 009) Employment, Training and Business Number of economically active ETD 005 (Q) people assisted into work each year (Cum) The state of the economy continues to be fragile - despite this we are succeeding in helping a number of peopel find work, and for this quarter at least this reflects the local unemployment figures which are reducing. The number of unemployed people receiving advice and guidance ETD 006 (Q) (Cum) 87 87 130 133 190 205 The number of new business startups supported each year ETD 007 (Q) (Cum) 8 11 16 29 25 68 Some of these businesses are being assisted on an ongoing basis. As of December, a total of 88 businesses have been receiving support in the Pathfinder Business Advice Project since it started in May but these were not included in the figures reported here. The number of businesses assisted to retain jobs and/or increase employment each year. ETD 008 (Q) (Cum) 3 16 6 65 9 113 Some of these businesses are being assisted on an ongoing basis. As of December, a total of 88 businesses have been receiving support in the Pathfinder Business Advice Project since it started in May but these were not included in the figures reported here. Leisure and Culture Participation at NNDC Sporting Facilities LC 004 (Q) (Cum) 122,925 129,222 258,175 270,062 371,550 384,872 Number of Events Organized at Country Parks LC 005 (Q) (Cum) 10 9 35 29 40 43 The unemployed represent just over half of the people we come into contact with. We are increasingly engaging with people who are in work but who are looking at alternatives as a means of staying economically active. Page 1 of 3 Appendix N PERFORMANCE MANAGEMENT Indicator Name Reference Visits To and Use Of Museums: all visits (Was BV 170a) LC 007a (Q) (Cum) Community Engagement Number of Anti Social Behaviour Referrals (QUARTERLY REPORT AS AT 31st December 2010) Q1 Target Q1 Result Q2 Target Q2 Result Q3 Target 145.00 152.54 300.00 332.90 455.00 419.39 SC 021 (Q) (Cum) 38 75 76 140 114 271 Percentage of successful low level interventions (stage 1 & 2) SC 025 (Q) (Cum) 60.00% 98.00% 60.00% 98.00% 60.00% 99.00% Environmental Sustainability Waste - Commercial - Number of trade waste customers who recycle ES 022 (Q) 800 840 800 890 875 906 47.50% 47.46% 47.50% 45.98% 47.50% 47.39% 75,000 121,845 155,000 349,364 220,000 524,018 The website underwent optimisation in early September 2010 to increase its visibility and ranking on search engines, particularly Google, when people use them to browse the internet. This has resulted in more people accessing the website and thus, the significant increase in the number of estimated visitors during the second and third quarters. 165,000 215,125 420,000 555,869 460,000 619,902 We are still continuing to see an increase in visitor numbers across the Tourist Information Centres. 1 1 1 1 1 1 Percentage of household waste sent NI 192 (Q) for reuse, recycling and composting (Cum) Tourism Number of estimated users of the 'Visitnorthnorfolk.Com' website ETD 012 (Q) (Cum) Number of People using Tourist Information and Visitor Centres CS 004 (Q) (Cum) Planning and Coastal Management Coastal Zone Management Solution: CM 001 (Q) Milestones - Yes/No Progress Report (Cum) Q3 Result Q3 Status Q3 Comment The Norfolk Museums and Archaeology Service no longer collect this data, as the figures often proved inconsistent across the service. This was due to problems when recording different things for enquiries, etc., resulting in numbers varying greatly and therefore the figures could not be relied upon. I therefore recommend, in the main body of this report, that we withdraw this target. We have again seen an increase in recycling customers which could be attributed to the need for loca businesses to utilise more cost effective services. Works at Beeston Regis completed. All Happisburgh projects proceeding to plan. Cromer footpath project commenced. 88 businesses signed up for support. Draft report for Wolferton submitted. Full progress reports are available on the Pathfinder website at http://www.northnorfolk.org/pathfinder/ Conservation Areas - Character Appraisals (Was BV 219b) CDL 005b (Q) (Cum) 25.00% 25.00% 25.00% 26.80% 27.00% 26.80% Progress with Conservation Area Appraisals was affected in the third quarter of this year by the need to give additional support to the Development Mangement service and other priorities in respect of Conservation Area Management viz. Article 4 Directions at Mundesley and issues arising from designation of Former RAF Coltishall Conservation Area in conjunction with Broadland DC. A consultant has recently been comissioned to undertake an Appraisal and Management Plan for Happisburgh Conservation Area. Completion of the fieldwork for this Conservation Area by the end of March 2011 would give an outturn of 28.4% on the original target for this indicator in the Corporate Plan for 2008-11. Conservation Areas - Management Proposals (Was BV 219c) CDL 005c (Q) (Cum) 25.00% 25.00% 25.00% 26.80% 27.00% 26.80% See above Page 2 of 3 Appendix N PERFORMANCE MANAGEMENT Indicator Name Reference Processing of MAJOR planning applications (Quarterly Cumulative) (Was BV 109a) (QUARTERLY REPORT AS AT 31st December 2010) Q1 Target Q1 Result Q2 Target Q2 Result Q3 Target NI 157a (Q) (Cum) 60.00% 80.00% 60.00% 55.56% 60.00% 33.33% Processing of MINOR planning applications (Quarterly Cumulative) (Was BV 109b) NI 157b (Q) (Cum) 72.00% 71.43% 72.00% 67.13% 72.00% 65.58% Processing of OTHER planning applications (Quarterly Cumulative) (Was BV 109c) NI 157c (Q) (Cum) 85.00% 88.53% 85.00% 83.64% 85.00% 82.81% Delegation of Planning Decisions (Was BV 188) DC 001 (Q) (Cum) 90.00% 94.63% 90.00% 92.80% 90.00% 92.64% Plan-making: Milestones - Yes/No Progress Report (Was BV 200b) PP 001 (Q) (Cum) 1 1 1 1 1 1 Clean and Pollution Free District Flytipping investigated within 2 working days EH 003 (Q) (Cum) 100.00% 100.00% 100.00% 100.00% 100.00% 100.00% All other pollution complaints EH 037 (Q) responded to within 2 workings days 97.00% 96.20% 97.00% 95.29% 97.00% 95.17% 100.00% 98.82% 100.00% 96.46% 100.00% 96.67% Percentage of Council Tax collected RB 009 (Q) (Was BV 009) (Cum) 31.00% 30.84% 57.65% 57.56% 86.00% 85.46% Percentage of Non-domestic Rates collected (Was BV 010) RB 010 (Q) (Cum) 32.00% 32.94% 62.50% 63.88% 89.20% 89.88% HB Security - Prosecutions and Sanctions (Was RB 025) RB 021 (Q) (Cum) 10 16 20 32 32 43 2.25 1.73 4.50 3.46 6.75 5.67 First Class Resource Management Percentage of invoices paid on time FS 002 (Q) (Was BV 008) (Cum) Corporate Health Working Days Lost Due to Sickness OD 001 (Q) Absence (Whole Authority) (Was BV (Cum) 012) Q3 Result Q3 Status Q3 Comment Significant effort has been put in to clear the majority of older outstanding major applications in the third quarter. 12 major applications have been determined in the third quarter of which 10 were more than 13 weeks old. This has had a significant effect on this performance measure over the three quarters of this year as there have only been 21 determinations in total. Both SSP and Rural Buildings Policy pending adoption. Will be one month behind target due to Council Meeting cycle. Planning Obligations SPD yet to be progressed due to staff resource issues. Work re-programmed for second part of 2011. Still above target. Low is The figures for the third quarter are slightly higher than at the same period last year. It is not possible good at this stage to indicate what impact this will have on the annual overall figures yet. There has been an increase in the number of staff classed as long term sick for the first three quarters of the year 2010/11. The impact on long term absence on the first three quarters for 2009/10 was 54% of the tota number of days sick and for the first three quarters for 2010/11 this has risen to 59%. Overall though the figures are positive. Key Significantly below target -15% or more below target Slightly below target - 0 - 15% below target On or above target Page 3 of 3 Appendix N
