2015 Kogod Made in America Auto Index Associate Professor Frank DuBois
advertisement

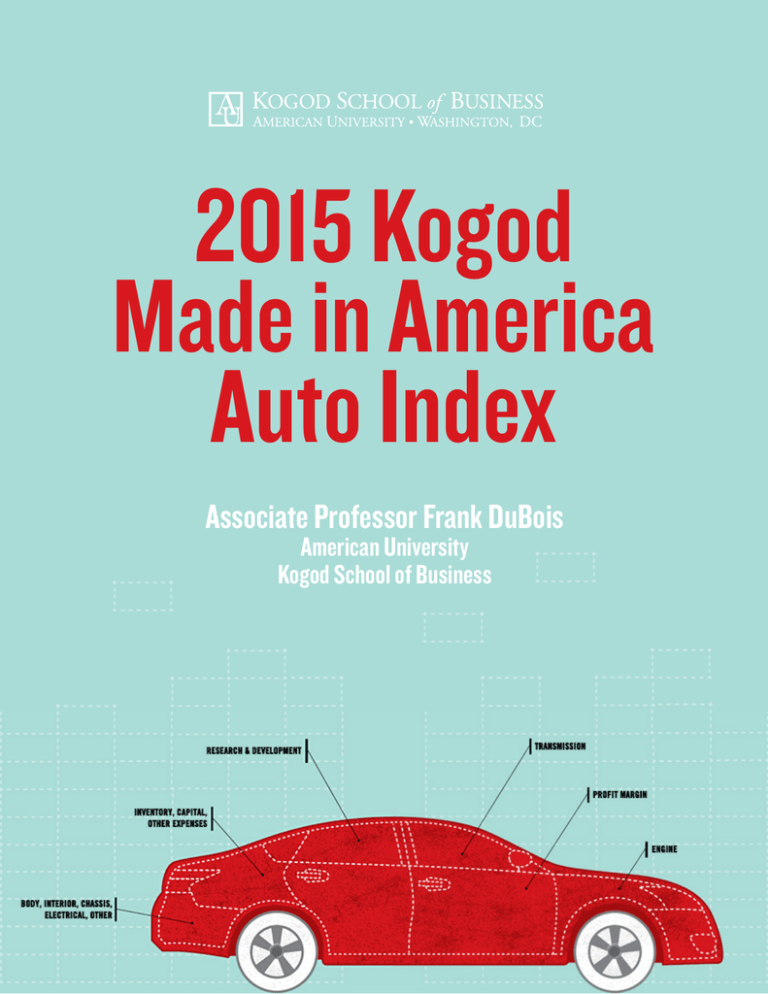
2015 Kogod Made in America Auto Index Associate Professor Frank DuBois American University Kogod School of Business Released May 21, 2015 Executive Summary To view the top vehicles in the 2015 Kogod Made in America Auto Index, please visit http://kogod.american.edu/autoindex. As corporate logistics, research, and production become increasingly globalized, identifying the country of origin for goods—especially vehicles—is becoming nearly impossible. The Kogod Made in America Auto Index factors all aspects of globalization into determining which countries can truly claim vehicles. This innovative ranking evaluates the domestic content of vehicles sold in the United States. of information available to consumers on vehicles’ manufacturing origin. The Kogod Made in American Auto Index incorporates AALA data in its calculation, but also includes seven other data points (Profit Margin, Labor, R&D, Transmission, Inventory, Capital, Other Expenses, Engine, Body, Chassis, Interior, Electrical) to create a more all-encompassing index. The Made in America Auto Index provides a more accurate picture of the production process for the most popular vehicles on the road today by incorporating seven categories beyond the somewhat misleading data provided by the American Automotive Labeling Act (AALA). It takes into account the ancillary impact of auto vehicle manufacturing on the U.S. economy and provides a better indication of the real economic impact that auto purchases have on the country based on where the vehicle is designed, assembled, and sold. The manufacture and sale of automobiles is an extremely important component of the U.S. economy. In 2014, the auto industry directly employed approximately 1.5 million workers and generated 16.7 million units in total vehicle sales, accounting for approximately 4 percent of the U.S. GDP.1 This employment also supported an additional 5.7 million jobs for a total of 7.5 million jobs that can be attributed to the industry. Of the 16.7 million vehicles sold in the US in 2014, approximately 11 million or 65 percent were produced in the United States. Since the 1994 passage of the AALA, automakers have been required to affix a label documenting the percentage of “American” content in each vehicle sold in the U.S. While this data is useful, it has some limitations. Most notably: 1. Canadian and U.S. content are not disaggregated; 2. Automakers can “round up” parts’ content from 70 to 100 percent to calculate domestic content; 3. Cars with very little U.S. content may be allowed to use labels from vehicles with higher U.S. content if they are part of the same carline. Unlike other “Made in America” indices, Kogod’s method accounts for production factors that may be ignored or discounted by other techniques. It assesses the gaps in AALA data, which are the sole source Economic Impact Methodology In calculating the index, Kogod Associate Professor Frank DuBois used seven data points derived from publicly available data. The weighted2 criteria are used to determine the “American” content of cars sold in the U.S. The criterion include: • • Profit Margin.3 Measured based on the location of an automaker’s headquarters. Profits from the sale of a vehicle return to shareholders in the automaker’s home country. If an automaker’s global headquarters is located in the U.S., the model receives a 6. If it is not, the model receives a 0 in this category. The Labor category considers where the car is assembled. Profits from the sale of each model Released May 21, 2015 • • • • • support its local labor force. If a model is assembled in the U.S., it receives a 6. If not, the model receives a 0 in this category. The location of a car’s Research & Development (R&D) activities. If the model is the product of a U.S. company, it receives a 6. If the model is the product of a foreign company but is assembled in the U.S. it receives a 3; and if it is a foreign import it receives a 1 in this category. The location of assembly helps to determine where Inventory, Capital, and Other Expenses should be allocated. If assembly occurs in the U.S., the model receives an 11; if not, the car receives a 0 in this category. Where a model’s Engine is produced. If it is produced in the U.S., the model receives a 14. If not it receives a 0. Finally, if a car’s Transmission is produced in the U.S., the model receives a 7. If not, it receives a 0. We assign 50 percent of a vehicle’s score to the Body, Chassis, and Electrical Components category. We take the AALA percentage and divide it by two to derive the score. The index reveals that vehicles produced by automakers whose headquarters are located in the U.S. rated higher in overall domestic content because the profit derived from the sale of these vehicles was more likely to return or remain in the U.S. This is also due to the fact that a majority of the R&D activities of companies headquartered in the U.S. take place here. In contrast to indices that use only AALA data to determine vehicle rankings, the Kogod index ranks foreign companies lower in U.S. content, even if these firms engaged in significant levels of U.S. sourcing and manufacture. We argue that a true index of “localness” must recognize the firm’s country of origin as well as the location of its research and development activities. It is laudable that foreign manufacturers have increased their rate of sourcing and manufacture in the U.S.; however, the true impact of these activities on the U.S. economy is reduced by the repatriation of profits back to the automaker’s home country, and by limitations in the amount of R&D activities performed in the U.S. Media Inquiries For interview requests and questions about Frank DuBois’s research, please contact: Ericka Floyd Public Relations Manager, University Communications Phone: 202-885-5935 Email: efloyd@american.edu Notes: See http://www.autoalliance.org/auto-jobs-and-economics/2015-jobs-report and Center for Automotive Research, Contribution of the Auto Industry to the Economies of all Fifty State and the United States, Ann Arbor, MI, January 2015. 1 2 There are several studies that estimate the contribution to covering “costs” and “profits” in the vehicle assembly value chain. See for example, Klier and Rubenstein (2008) “Who really made your car? Restructuring and Geographic Change in the Auto Industry.” See also research reports produced by the Center for Automotive Research (CAR) in Ann Arbor, MI. In the case of the recent acquisition of Chrysler by Fiat to create Fiat Chrysler Automotive (FCA) and to account for the significant U.S. footprint created by Chrysler operations, we assigned a value of 3 percent to Profit Margin and R&D respectively. 3


