Document 12914459
advertisement
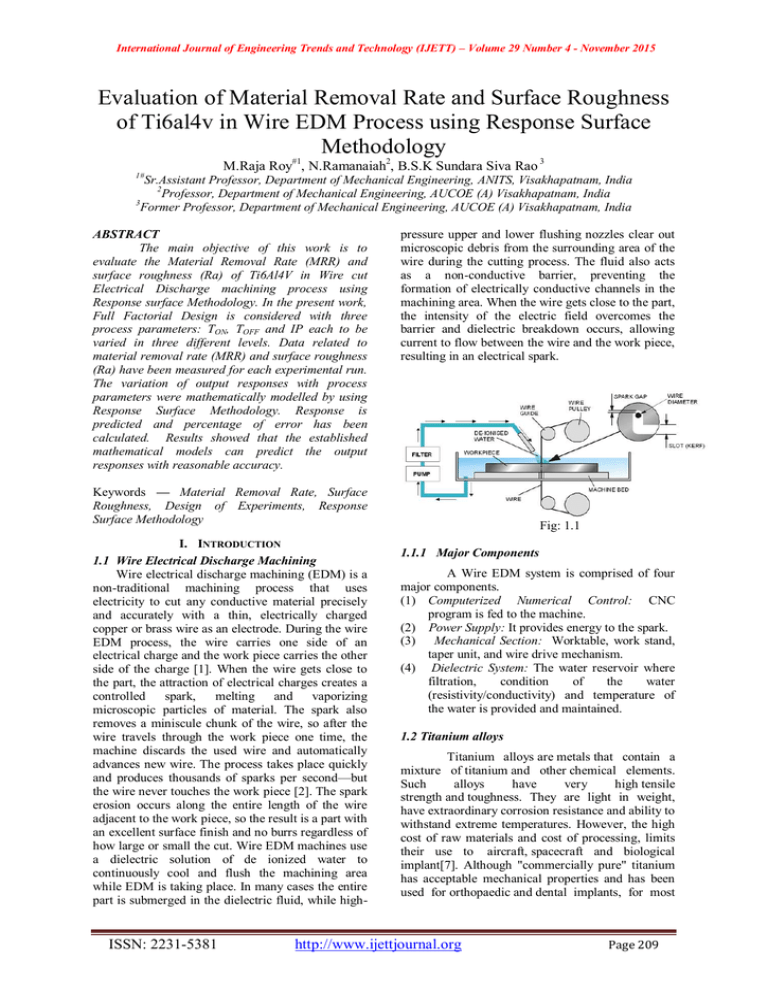
International Journal of Engineering Trends and Technology (IJETT) – Volume 29 Number 4 - November 2015 Evaluation of Material Removal Rate and Surface Roughness of Ti6al4v in Wire EDM Process using Response Surface Methodology M.Raja Roy#1, N.Ramanaiah2, B.S.K Sundara Siva Rao 3 1# Sr.Assistant Professor, Department of Mechanical Engineering, ANITS, Visakhapatnam, India 2 Professor, Department of Mechanical Engineering, AUCOE (A) Visakhapatnam, India 3 Former Professor, Department of Mechanical Engineering, AUCOE (A) Visakhapatnam, India ABSTRACT The main objective of this work is to evaluate the Material Removal Rate (MRR) and surface roughness (Ra) of Ti6Al4V in Wire cut Electrical Discharge machining process using Response surface Methodology. In the present work, Full Factorial Design is considered with three process parameters: TON, TOFF and IP each to be varied in three different levels. Data related to material removal rate (MRR) and surface roughness (Ra) have been measured for each experimental run. The variation of output responses with process parameters were mathematically modelled by using Response Surface Methodology. Response is predicted and percentage of error has been calculated. Results showed that the established mathematical models can predict the output responses with reasonable accuracy. pressure upper and lower flushing nozzles clear out microscopic debris from the surrounding area of the wire during the cutting process. The fluid also acts as a non-conductive barrier, preventing the formation of electrically conductive channels in the machining area. When the wire gets close to the part, the intensity of the electric field overcomes the barrier and dielectric breakdown occurs, allowing current to flow between the wire and the work piece, resulting in an electrical spark. Keywords — Material Removal Rate, Surface Roughness, Design of Experiments, Response Surface Methodology I. INTRODUCTION 1.1 Wire Electrical Discharge Machining Wire electrical discharge machining (EDM) is a non-traditional machining process that uses electricity to cut any conductive material precisely and accurately with a thin, electrically charged copper or brass wire as an electrode. During the wire EDM process, the wire carries one side of an electrical charge and the work piece carries the other side of the charge [1]. When the wire gets close to the part, the attraction of electrical charges creates a controlled spark, melting and vaporizing microscopic particles of material. The spark also removes a miniscule chunk of the wire, so after the wire travels through the work piece one time, the machine discards the used wire and automatically advances new wire. The process takes place quickly and produces thousands of sparks per second—but the wire never touches the work piece [2]. The spark erosion occurs along the entire length of the wire adjacent to the work piece, so the result is a part with an excellent surface finish and no burrs regardless of how large or small the cut. Wire EDM machines use a dielectric solution of de ionized water to continuously cool and flush the machining area while EDM is taking place. In many cases the entire part is submerged in the dielectric fluid, while high- ISSN: 2231-5381 Fig: 1.1 1.1.1 Major Components A Wire EDM system is comprised of four major components. (1) Computerized Numerical Control: CNC program is fed to the machine. (2) Power Supply: It provides energy to the spark. (3) Mechanical Section: Worktable, work stand, taper unit, and wire drive mechanism. (4) Dielectric System: The water reservoir where filtration, condition of the water (resistivity/conductivity) and temperature of the water is provided and maintained. 1.2 Titanium alloys Titanium alloys are metals that contain a mixture of titanium and other chemical elements. Such alloys have very high tensile strength and toughness. They are light in weight, have extraordinary corrosion resistance and ability to withstand extreme temperatures. However, the high cost of raw materials and cost of processing, limits their use to aircraft, spacecraft and biological implant[7]. Although "commercially pure" titanium has acceptable mechanical properties and has been used for orthopaedic and dental implants, for most http://www.ijettjournal.org Page 209 International Journal of Engineering Trends and Technology (IJETT) – Volume 29 Number 4 - November 2015 applications titanium is alloyed with small amounts of aluminium and vanadium, typically 6% and 4% respectively, by weight. 1.2.1 Transition Temperature The crystal structure of titanium at ambient temperature and pressure is close-packed hexagonal α phase with a c/a ratio of 1.587. At about 890°C, the titanium undergoes an allotropic transformation to a body-centred cubic β phase which remains stable to the melting temperature. Some alloying elements raise the alpha-tobeta transition temperature (i.e., alpha stabilizers) while others lower the transition temperature (i.e., beta stabilizers). Aluminium,gallium, germanium, carbon, oxygen an d nitrogen are alpha stabilisers. Molybdenum, vanadium, tantalum, niobium, manganese, iron, chromium, cob alt, nickel, copper and silicon are beta stabilizers. 1.2.2 Ti6Al4V or Ti-Grade5 Ti Grade 5, also known as Ti6Al4V or Ti 6-4, is the most commonly used alloy. It has a chemical composition of 6% aluminium, 4% vanadium, 0.25% (maximum)iron, 0.2% (maximum) oxygen, and the remainder titanium. It is significantly stronger than commercially pure titanium while having the same stiffness and thermal properties (excluding thermal conductivity, which is about 60% lower in Grade 5 Ti than in CP Ti). Among its many advantages, it is heat treatable. This grade is an excellent combination of strength, corrosion resistance and weld ability. II. LITERATURE REVIEW Vikram Singh et al [1] devised an approach to determine machining parameter settings for WEDM process. Based on the taguchi quality design and the analysis by Response surface method, the significant factors affecting the machining performance such as MRR, surface roughness, sparking frequency, average gap voltage, and normal ratio are determined. By means of regression analysis, mathematical models relating the machining performance and various machining parameters are established. Based on the mathematical models developed, an objective function under the multi-constraint conditions is formulated. Experimental results demonstrate that the machining models are appropriate and the derived machining parameters satisfy the real requirements in practice. Pratik A. Patil & C.A. Waghmare et al [2] used the Response Surface Methodology approach for maximizing the material removal rate in wire ISSN: 2231-5381 electrical discharge machining. The investigated machining parameters were wire tension, pulse on time and peak current. Machining was carried on AISI D2 cold work steel, which is widely used in die and mould making industries. The experiments were designed based on response surface design method; in which central composite design method was applied for fitting the second order model. After the experimentation, the effect of the parameters on MRR was determined by analysis of variance (ANOVA). Also the interaction of their parameters was considered for their significance. Regression analysis was done and a second order mathematical model was fitted for MRR considering the parameters and their significant interactions. R.Pandithurai & I. Ambrose Edward et al [3] optimized the process parameters for Wire electro discharge machining (WEDM).WEDM is extensively used in tool and die industries. Precision and intricate machining are the strengths. While machining time and surface quality still remains as major challenges. The main objective of this study is to obtain higher material removal rate (MRR) and lower surface roughness (SR). Ton, T off, Gap voltage and wire feed rate are the four control factors taken each at various levels. The genetic algorithm optimization tool is used to find the factors level that create a low surface roughness in WEDM. S V Subrahmanyam & M. M. M. Sarcar et al [4] has demonstrated the optimization of Wire Electrical Discharge Machining process parameters for the machining of H13 HOT DIE STEEL, with multiple responses Material Removal Rate (MRR), surface roughness (Ra) based on the Grey–Taguchi Method. Taguchi’s L27 (21x38) Orthogonal Array was used to conduct experiments, which correspond to randomly chosen different combinations of process parameter setting, with eight process parameters: TON, TOFF, IP, SV WF, WT, SF, WP each to be varied in three different levels. Data related to the each response viz. material removal rate (MRR), surface roughness (Ra) have been measured for each experimental run; The variation of output responses with process parameters were mathematically modelled by using non-linear regression analysis. The models were checked for their adequacy. Result of confirmation experiments showed that the established mathematical models can predict the output responses with reasonable accuracy. John O. Rawlings, Sastry G. Pantula & David A. Dickey et al [5 developed least squares and related statistical methods without becoming excessively mathematical. The emphasis is on regression concepts, rather than on mathematical proofs. Proofs are given only to develop facility with matrix algebra and comprehension of mathematical http://www.ijettjournal.org Page 210 International Journal of Engineering Trends and Technology (IJETT) – Volume 29 Number 4 - November 2015 relationships. Good students, even though they may not have strong mathematical backgrounds, quickly grasp the essential concepts and appreciate the enhanced understanding. The learning process is reinforced with continuous use of numerical examples throughout the text and with several case studies. Scott F. Miller, Albert J. Shih & Jun Qu et al [6] developed a new, advanced engineering materials and the need for precise and flexible prototypes and low volume production have made the wire electrical discharge machining (EDM) an important manufacturing process to meet such demands. This research investigates the effect of spark on-time duration and spark on-time ratio, two important EDM process parameters, on the material removal rate (MRR) and surface integrity of four types of advanced material: porous metal foams, metal bond diamond grinding wheels, sintered NdFe-B magnets, and carbon–carbon bipolar plates. An experimental procedure was developed. During the wire EDM, five types of constraints on the MRR due to short circuit, wire breakage, machine slide speed limit, and spark on-time upper and lower limits are identified. An envelope of feasible EDM process parameters is generated for each work-material. Applications of such a process envelope to select process parameters for maximum MRR and for machining of micro features are discussed. Results of Scanning Electron Microscopy (SEM) analysis of surface integrity are presented. Fig -3.2 Specimens obtained from Wire EDM 3.2 Design of Experiments Design of Experiments is an analytical method commonly used to statistically signify the relationship between input parameters to output responses. DOE has wide applications especially in the field of engineering for the purpose of process development, optimization and validation tests. DOE is essentially an experimental based modeling and is a designed experimental approach which is far superior to unplanned approach whereby a systematic way will be used to plan the experiment, collect the data and analyze the data. In the present work a mathematical model has been developed by Response Surface Methodology. Optimization and Desirability functions obtained helps to optimize characteristics considered for Maximum Material Removal Rate and Minimum Surface Roughness. Process variable for Wire EDM are Considered as Pulse on Time(T-on), Pulse off Time(T-off) and Peak Current(IP). Process variable considered based on the literature[3] and Machine settings are shown in Table-3.1 III. EXPERIMENTATION 3.2 .1Process Variables 25 6 3.1Preparing the Specimens Ti6Al4V material was purchased from SOUTH ASIA Metal Corporation, Mumbai. Raw material is in the form of a bar of 25.4mm diameter. Four pieces of 10mm length and 25.4mm diameter are cut on power saw. Using wire EDM seven specimens from each block are obtained by varying the factor considered in DOE. 27 specimens are used for the present work. Drawing for Wire EDM is shown in Fig-3.1 and specimens obtained after machining are shown in Fig-3.2. Table 3.1: Process variables and their limits Levels S.No Parameters Symbol 1 2 3 Pulse-on 1 time (micro Ton 100 105 110 secs) Pulse-off 2 time (micro Toff 45 50 55 secs) Peak 3 current Ip 10 11 12 (amp) 3.3 Minitab Software 10 6 Fig 3.1 Drawing for wire EDM ISSN: 2231-5381 Minitab is a statistics package. It was developed at the Pennsylvania State University by researchers Barbara F. Ryan, Thomas A. Ryan, Jr., and Brian L. Joiner in 1972. Minitab began as a light version of MNITAB, a statistical analysis program by NIST. Minitab is distributed by Minitab Inc, a privately owned company headquartered in State College. Pennsylvania, with subsidiaries in Coventry, http://www.ijettjournal.org Page 211 International Journal of Engineering Trends and Technology (IJETT) – Volume 29 Number 4 - November 2015 England, Paris, France and Sydney, Australia. Minitab is often used in conjunction with the implementation of Six sigma, CMMI and other statistics-based process improvement methods. 3.4 Full Factorial Method Experiments have been carried out using full factorial method. Experimental design which consists of 27 combinations of Ton, Toff and IP. According to the design catalogue prepared by factorial design of experiment has been found suitable in the present work. It considers three process parameters to be varied in three discrete levels. The experimental design has been shown in Table 3.2 (all factors are in coded form). Factorial design is used for conducting experiments as it allows study of interactions between factors. Interactions are the driving force in many processes. 3.5 Material Removal Rate The material removal rate of the work piece is calculated by using the formula MRR (2Wg D ) t Vc mm3/min Where: Wg = Spark gap, varies from 0.04mm to 0.06mm, D = diameter of the wire = 0.25mm t = Thickness of the work piece in mm Vc = Cutting speed in mm/min 3.6 Surface Roughness Surface roughness is measured using Surface Roughness Tester which directly shows the reading when placed on the metal surface. It consists of a stylus which moves on to the surface of the metal. This directly shows the surface roughness value in terms of any desired unit. Fig 3.3 shows the surface roughness tester. Table 3.2 DOE in Coded form Expt No. 1 2 3 4 5 6 7 8 9 10 11 12 13 14 15 16 17 18 19 20 21 22 23 24 25 26 27 Ton 1 3 1 3 1 2 3 3 3 1 1 2 1 2 2 3 1 3 3 2 2 2 3 2 1 1 2 Toff 2 1 2 3 1 1 2 3 3 1 1 3 2 2 1 2 3 1 2 1 3 2 1 3 3 3 2 IP 2 3 3 1 3 1 3 3 2 1 2 2 1 1 3 1 1 2 2 2 1 2 1 3 2 3 3 Fig 3.3 Surface Roughness Tester IV. RESUTS AND DISCUSSIONS 4.1 Response Surface Methodology Response surface methodology uses statistical models, and therefore even the best statistical model is an approximation to reality. In practice, both the models and the parameter values are unknown, and subject to uncertainty on top of ignorance. An estimated optimum point need not be optimum in reality, because of the errors of the estimates and of the inadequacies of the model. Response surface methodology has an effective track-record of helping researchers improve products and services. 4.2 Mathematical model of Response Surface Methodology The Response Surface is described by a second order polynomial equation of the form Y is the corresponding response (1,2, . . . , S) are coded levels of S quantitative process variables, ISSN: 2231-5381 http://www.ijettjournal.org Page 212 International Journal of Engineering Trends and Technology (IJETT) – Volume 29 Number 4 - November 2015 The terms are the second order regression coefficients, Second term is attributable to linear effect, Third term corresponds to the higher-order effects, Fourth term includes the interactive effects, The last term indicates the experimental error. 4.2.1. Response Surface Methodology in Minitab In this paper Minitab17 Trial version is used to obtain the Response Surface Regression equations, Fitted values and residual for Material Removal Rate and Surface Roughness. 4.3 Mathematical Relationship between the Input Parameters and Metal Removal Rate The mathematical relationship for correlating the Metal removal rate and the considered process variables has been obtained as follows MRR = -54+ 0.99 Ton- 0.41 Toff+ 4.6 IP0.0033 Ton*Ton- 0.0108 Toff*Toff0.066 IP*IP+ 0.0077 Ton*Toff- 0.0565 Ton*IP + 0.0520 Toff*IP 4.3.1 Normal Probability Plot for MRR The normal probability plotin the Fig:4.1 shows a clear pattern indicating that all the factors and their interaction given in are affecting the MRR. In addition, the errors are normally distributed and the regression model is well fitted with the observed values. Fig: 4.1 Normal Probability Plot for MRR Table 3.1 Predicted values and % Error for MRR S.No T-On T- IP MRR MRR % 1 100 10 12.21 2 105 45 Off 50 11 13.53 12.63 Predict 12.449 3.44 Error 7.99 3 105 55 10 12.54 11.49 8.37 4 100 50 10 12.87 11.9 7.54 5 105 55 12 12.87 11.641 9.55 6 100 50 12 12.54 12.096 3.54 7 100 50 11 13.45 12.064 10.3 8 105 55 10 12.54 11.49 8.37 9 105 45 10 11.81 13.105 10.97 10 110 45 11 14.19 12.754 10.12 11 110 55 12 12.87 11.771 8.54 12 100 55 12 10.56 11.346 7.44 13 100 55 11 10.45 11.054 5.78 14 110 45 12 12.54 11.961 4.62 15 110 55 11 12.54 12.044 3.96 16 110 50 11 11.55 12.669 9.69 17 105 45 12 11.55 12.216 5.77 4.3.3 Main Effect of Input Parameters 18 105 45 11 13.2 12.7265 3.59 19 105 50 10 12.21 12.5675 2.93 20 110 50 11 11.55 12.669 9.69 21 110 50 10 14.52 13.07 9.99 A main effect occurs when the mean response changes across the levels of a factor. Main effect plots are used to compare the relative strength of the effects across factors. 22 110 55 10 11.88 12.185 2.57 23 100 45 12 12.54 12.306 1.87 24 105 50 12 13.53 12.1985 9.84 25 110 45 10 15.475 13.415 13.31 26 100 45 11 14.484 12.534 13.46 27 105 55 11 12.21 11.6315 4.74 ISSN: 2231-5381 4.3.2 Standardized Residual Vs Fitted Value for MRR Fig:4.2 indicates that the maximum variation which shows the high correlation that, exists between fitted values and observed values. Fig: 4.2 Residual vs Fitted Values for MRR http://www.ijettjournal.org Page 213 International Journal of Engineering Trends and Technology (IJETT) – Volume 29 Number 4 - November 2015 9 105 45 10 3.88 3.6405 6.17 10 110 45 11 4.085 3.90075 4.51 11 110 55 12 4.24 4.45275 5.02 12 100 55 12 3.945 3.72175 5.66 13 100 55 11 3.765 3.17675 15.62 12.4 14 110 45 12 4.205 4.56875 8.65 12.2 15 110 55 11 3.96 3.70275 6.5 16 110 50 11 4.625 4.419 4.45 17 105 45 12 4.485 4.1155 8.24 18 105 45 11 3.345 3.55 6.13 19 105 50 10 3.84 4.12775 7.49 20 110 50 11 4.625 4.419 4.45 21 110 50 10 4.775 4.366 8.57 22 110 55 10 3.57 3.60875 1.09 23 100 45 12 4.31 3.79775 11.89 24 105 50 12 5.235 4.68475 10.51 25 110 45 10 3.635 3.88875 6.98 26 100 45 11 3.205 3.33475 4.05 27 105 55 11 3.33 3.372 1.26 M ain Effects Plot for M RR Fitted Means Ton Toff IP 13.2 Mean of MRR 13.0 12.8 12.6 12.0 100 105 110 45 50 55 10 11 12 All displayed terms are in the model. Fig: 4.3 Main Effects plot for MRR 4.3.4 Interaction Effects Fig: 4.4 Interaction Effects plot for MRR 4.4 Mathematical Relationship between the Input Parameters and Surface Roughness The mathematical relationship for correlating the Metal removal rate and the considered process variables has been obtained as follows Ra = 30.1 - 0.72 Ton + 2.403 Toff - 9.50 IP + 0.00271 Ton*Ton - 0.02469 Toff*Toff + 0.328 IP*IP - 0.00040 Ton*Toff + 0.0205 Ton*IP + 0.0082 Toff*IP 4.4.1 Normal Probability Plot For Ra The normal probability plot as shown in Fig:4.5 represents a clear pattern (as the points are almost in a straight line) indicating that all the factors and their interaction given in are affecting the Ra. In addition, the errors are normally distributed and the regression model is well fitted with the observed values Table 3.2 Predicted values and % Error for Ra S.No T-On T- IP Ra Ra %Error 1 100 Off 45 10 3.56 Predict 3.52775 0.91 2 105 50 11 4.24 4.07825 3.81 3 105 55 10 3.185 3.3805 6.14 4 100 50 10 4.64 4.025 13.25 5 105 55 12 4.08 4.0195 1.48 6 100 50 12 3.69 4.377 18.62 7 100 50 11 3.105 3.873 24.73 8 105 55 10 3.185 3.3805 6.14 ISSN: 2231-5381 Fig: 4.5 Normal Probability Plot for Ra 4.3.2 Standardized Residual Vs Fitted Value for Surface Roughness Fig:4.6 indicates that the maximum variation which shows the high correlation that, exists between fitted values and observed values. http://www.ijettjournal.org Page 214 International Journal of Engineering Trends and Technology (IJETT) – Volume 29 Number 4 - November 2015 Fig: 4.6 Residual vs Fitted Values for Surface Roughness Fig: 4.6 Optimisation plot for MRR and Surface Roughness 4.3.3 Main Effect of Input Parameters M ain Effects Plot for Ra Fitted M eans Ton Toff IP 4.75 Mean of Ra 4.50 4.25 4.00 3.75 3.50 100 105 110 45 50 55 10 11 12 All displayed terms are in the model. Fig: 4.7 Main Effects plot for Surface Roughness 4.3.4 Interaction Effects The optimization plot as shown in the fig signifies the affect of each factor (columns) on the responses or composite desirability (rows). The vertical red lines on the graph represent the current factor settings. The numbers displayed at the top of a column show the current factor level settings (in red). The horizontal blue lines and numbers represent the responses for the current factor level. Minitab calculates the maximum material removal rate and minimum surface roughness. From the optimization plot it can be said that the maximum material removal rate is 13.4545 and the minimum surface roughness is 3.5568 obtained when Ton is 104.6465, Toff is 45.0, IP is 10.3434. V. CONCLUSION Fig: 4.4 Interaction Effects plot for Surface Roughness 4.4 Optimisation Plot: A Minitab response optimizer tool shows how different experimental settings affect the predicted responses for factorial, response surface, and mixture designs. The optimal solution serves as the starting point for the plot. This optimization plot allows to interactively changing the input variable settings to perform sensitivity analyses and possibly improve the initial solution. ISSN: 2231-5381 In this work, two performance parameters Surface Roughness and Material Removal Rate are investigated by varying the three Process (machining) parameters on Ti6Al4V with Brass wire as electrode in wire electric discharge machine. The performance parameters included pulse on time (Ton), Pulse off time (Toff) and Input Voltage (IP). Experiments were conducted according to Full factorial Design. The optimum parameters value combination was found which would yield minimum Surface Roughness (Ra) and maximum Material Removal Rate (MRR) . Regression Equation has been obtained successfully, to find the Material Removal Rate and Surface Roughness. Response optimizer in Minitab software is used for optimization of Surface Roughness and Material Removal Rate. Experimental values and Predicted values obtained by Response surface regression are good in agreement with less than 10% error. http://www.ijettjournal.org Page 215 International Journal of Engineering Trends and Technology (IJETT) – Volume 29 Number 4 - November 2015 REFERENCES [1] Vikram Singh & S.K. Pradhan, Optimization of WEDM parameters using Taguchi technique and Response Surface Methodology in machining of AISI D2 Steel, Procedia Engineering 97 ( 2014 ) 1597 – 1608, www.elsevier.com/locate,procedia [2] Pratik a. Patil & C.A. Waghmare, optimization of process parameters in wire-edm using Response surface methodology, proceedings of 10 irf international conference, 01 june-2014, pune, india, isbn: 978-93-84209-23-0. [3] R.Pandithurai, I. Ambrose Edward, Optimizing surface roughness in Wire EDM using machining parameters, International Journal of Innovative Research in Science, Engineering and Technology , Volume 3, Special Issue 3, March 2014 2014 IEEE International Conference on Innovations in Engineering and Technology (ICIET’14) [4] S V Subrahmanyam, M. M. M. Sarcar, Evaluation of Optimal Parameters for machining with Wire cut EDM Using GreyTaguchi Method, International Journal of Scientific and Research Publications, Volume 3, Issue 3, March 2013 ISSN 2250-3153 [5] John O. Rawling, Sastry G. Pantula, David A. Dickey, Applied Regression Analysis: A Research Tool,Second Edition, Springer Texts in Statistics [6] Scott F. Miller, Albert J. Shih, Jun Qu, Investigation of the spark cycle on material removal rate in wire electrical discharge machining of advanced materials, International Journal of Machine Tools & Manufacture 44 (2004) 391–400, www.elsevier.com/locate/ijmatool [7] Titanium: A Technical Guide, 2nd Edition (#06112G), Introduction to Selection of Titanium Alloys, www.asminternational.org [8] Y.S.Liao, J.T.Huang, and H.C.Su , A study on the machiningparameters optimization of wire electrical discharge machining, J. Mater. Process. Technol, 71, 487–493(1997). [9] T.A. Spedding, and Z.O. Wang , Parametric optimization and surface characterization of wire electrical discharge machining process. Precision Eng, 20, 5–15 (1997). [10] Tosun, N., Determination of optimum parameters for multi performance characteristics in drilling by using grey relational analysis. Int,.J. Adv. Manuf. Technol., 28, 450–455. 2006 [11] Y.S Liao , J.T.Huang, A study on the machining parameter optimization of WEDM, Journal of Material Processing Technology,71(1997) pp.487-493. [12] S.S Mohapatra, Amar pattnaik,Optimization of WEDM process parameters using Taguchi method, International Journal of Advanced manufacturing Technology (2006). [13] R. E. Williams and K. P. Rajurkar, Study of wire electrical discharged machine surface characteristics, Journal of Materials Processing Technology,28(1991) pp. 127-138. ISSN: 2231-5381 http://www.ijettjournal.org Page 216

