Exam No. 3 Econ 14.05
advertisement
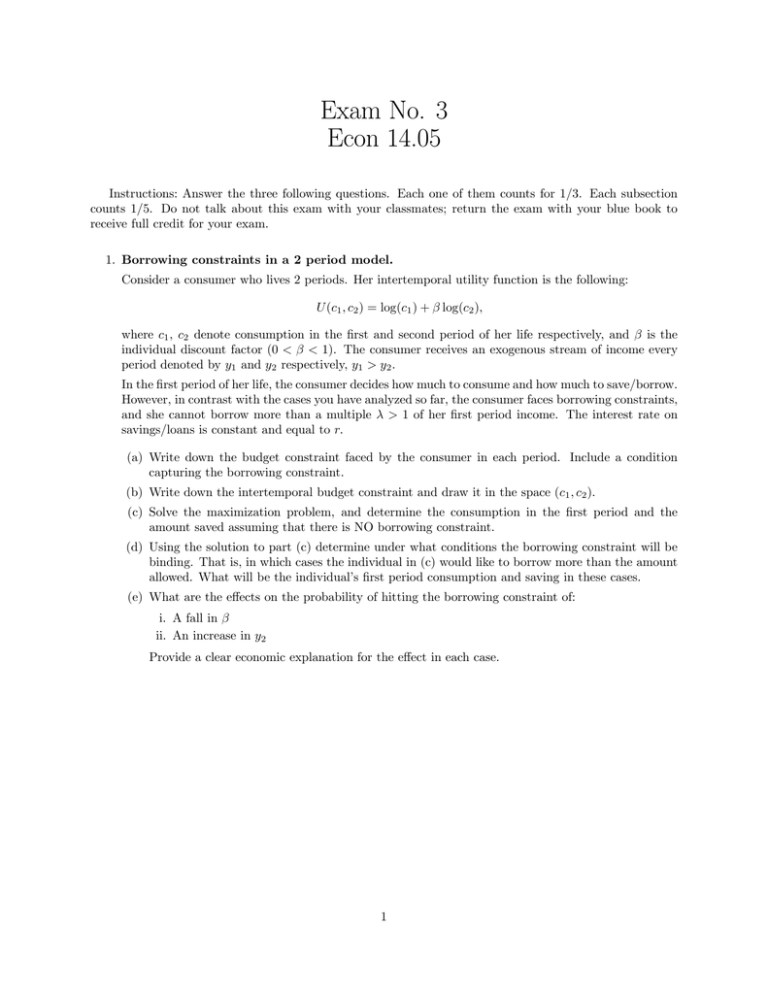
Exam No. 3 Econ 14.05 Instructions: Answer the three following questions. Each one of them counts for 1/3. Each subsection counts 1/5. Do not talk about this exam with your classmates; return the exam with your blue book to receive full credit for your exam. 1. Borrowing constraints in a 2 period model. Consider a consumer who lives 2 periods. Her intertemporal utility function is the following: U (c1 , c2 ) = log(c1 ) + β log(c2 ), where c1 , c2 denote consumption in the first and second period of her life respectively, and β is the individual discount factor (0 < β < 1). The consumer receives an exogenous stream of income every period denoted by y1 and y2 respectively, y1 > y2 . In the first period of her life, the consumer decides how much to consume and how much to save/borrow. However, in contrast with the cases you have analyzed so far, the consumer faces borrowing constraints, and she cannot borrow more than a multiple λ > 1 of her first period income. The interest rate on savings/loans is constant and equal to r. (a) Write down the budget constraint faced by the consumer in each period. Include a condition capturing the borrowing constraint. (b) Write down the intertemporal budget constraint and draw it in the space (c1 , c2 ). (c) Solve the maximization problem, and determine the consumption in the first period and the amount saved assuming that there is NO borrowing constraint. (d) Using the solution to part (c) determine under what conditions the borrowing constraint will be binding. That is, in which cases the individual in (c) would like to borrow more than the amount allowed. What will be the individual’s first period consumption and saving in these cases. (e) What are the effects on the probability of hitting the borrowing constraint of: i. A fall in β ii. An increase in y2 Provide a clear economic explanation for the effect in each case. 1 2. Recessions and fiscal policy in an overlapping generations model Consider an economy described by an overlapping generations model with government. Individuals live for 2 periods. In the first period of her life (when young) , each individual works and earns wt (wage per unit of labor), pay taxes for Tt , and saves. Savings can be used to buy physical assets (for an amount st ) and government bonds (for an amount bt+1 ). Both physical assets and government bonds pay the same interest rate (rt+1 ). However, only the investment in physical assets affects the capital stock. Population grows at a constant rate n, i.e. Lt+1 = (1 + n)Lt . The individual’s utility function is: U (c1t , c2t+1 ) = log(c1t ) + log(c2t+1 ), and production is Cobb-Douglas F (Kt , Lt ) = Ktα (At Lt )1−α (a) Assume that each individual maximizes her utility subject to her budget constraint. i. Determine the intertemporal budget constraint of each individual. ii. Use the budget constraint to solve for the first period consumption c1t and the first period saving in physical assets, st , taking the investment in government bonds (bt+1 ) as given. (b) Using the saving function derived in part a), and the production function: i. Prove that the wage wt , as a function of kt = Kt /Lt the capital per-capita, is given by: (1−α) α wt = (1 − α)At kt . Note: Even if you are not able to prove this part, you can still use the expression in the rest of the question. ii. Prove that the evolution of the capital stock per capita (NOT per unit of effective labor) is given by: 1 1 1 (1−α) α kt+1 = kt − (1 − α)At Tt − bt+1 2(1 + n) 2(1 + n) (1 + n) Again, even if you can’t prove it you can still use this expression in the following parts. (c) Using the expression derived for the growth of capital: i. For the case in which labor productivity, taxes, and bond emissions are constant (At = A, Tt = T, bt+1 = b) determine the expression that defines the equilibrium level of capital per capita. ii. Draw this relationship in the (kt+1 , kt ) space. Be precise about the details of the graph, in particular the points at which the curves cut the different axis How many equilibria does this economy exhibit? How many are stable? (d) Assume that initially the economy is in the highest stable equilibria. Then the economy experiences a productivity based recession, that is A falls from A0 to A1 (A1 < A0 ). i. What happens with the equilibrium level of capital and output? ii. Show the effect of the fall in productivity in a (kt+1 , kt ) graph. (e) Suppose that the government wants to stimulate the economy, that is to increase the equilibrium level of output: i. Can the government achieve its goal by reducing taxes and increasing bond emissions in the same amount (∆b = −∆T )? What is the economic reason? ii. Show the effect of this policy in a (kt+1 , kt ) graph. iii. Do you think this is a realistic prediction? iv. What feature of the model is behind this result? 2 3. Social Security (a) Explain what defined benefit and defined contribution retirement plans are. Classify Social Security. (b) Explain what unfunded and funded retirement plans are. In an OLG model, what are the long-run effects of moving from an unfunded to a funded plan? Explain in words; do not use equations. (c) Explain what baby boomers are and what problems they pose for Social Security. How do President Bush’s plans propose to solve these problems? (d) How does the introduction of Individual Accounts affect the future of Social Security under President Bush’s plans? (e) Are any other countries facing similar problems and/or proposing similar changes? What can we learn from the experience of other countries? 3


