Document 12860815
advertisement

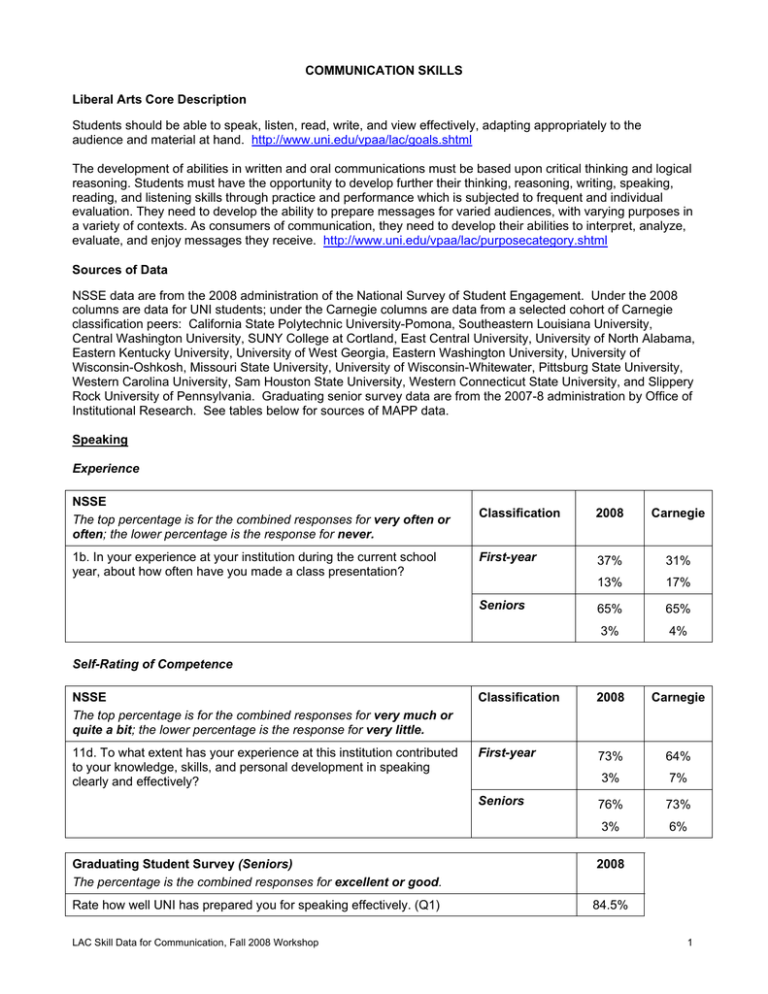
COMMUNICATION SKILLS Liberal Arts Core Description Students should be able to speak, listen, read, write, and view effectively, adapting appropriately to the audience and material at hand. http://www.uni.edu/vpaa/lac/goals.shtml The development of abilities in written and oral communications must be based upon critical thinking and logical reasoning. Students must have the opportunity to develop further their thinking, reasoning, writing, speaking, reading, and listening skills through practice and performance which is subjected to frequent and individual evaluation. They need to develop the ability to prepare messages for varied audiences, with varying purposes in a variety of contexts. As consumers of communication, they need to develop their abilities to interpret, analyze, evaluate, and enjoy messages they receive. http://www.uni.edu/vpaa/lac/purposecategory.shtml Sources of Data NSSE data are from the 2008 administration of the National Survey of Student Engagement. Under the 2008 columns are data for UNI students; under the Carnegie columns are data from a selected cohort of Carnegie classification peers: California State Polytechnic University-Pomona, Southeastern Louisiana University, Central Washington University, SUNY College at Cortland, East Central University, University of North Alabama, Eastern Kentucky University, University of West Georgia, Eastern Washington University, University of Wisconsin-Oshkosh, Missouri State University, University of Wisconsin-Whitewater, Pittsburg State University, Western Carolina University, Sam Houston State University, Western Connecticut State University, and Slippery Rock University of Pennsylvania. Graduating senior survey data are from the 2007-8 administration by Office of Institutional Research. See tables below for sources of MAPP data. Speaking Experience NSSE The top percentage is for the combined responses for very often or often; the lower percentage is the response for never. 1b. In your experience at your institution during the current school year, about how often have you made a class presentation? Classification 2008 Carnegie First-year 37% 31% 13% 17% 65% 65% 3% 4% Seniors Self-Rating of Competence NSSE The top percentage is for the combined responses for very much or quite a bit; the lower percentage is the response for very little. Classification 2008 Carnegie 11d. To what extent has your experience at this institution contributed to your knowledge, skills, and personal development in speaking clearly and effectively? First-year 73% 64% 3% 7% 76% 73% 3% 6% Seniors Graduating Student Survey (Seniors) The percentage is the combined responses for excellent or good. 2008 Rate how well UNI has prepared you for speaking effectively. (Q1) 84.5% LAC Skill Data for Communication, Fall 2008 Workshop 1 Listening Self-Rating of Competence Graduating Student Survey (Seniors) The percentage is the combined responses for excellent or good. 2008 Rate how well UNI has prepared you for listening effectively. (Q4) 87.5% Writing Experience NSSE The top percentage is for the combined responses for very often or often; the lower percentage is the response for never. Classification 2008 Carnegie 1c. In your experience at your institution during the current school year, about how often have you prepared two or more drafts of a paper or assignment before turning it in? First-year 48% 58% 18% 11% 37% 45% 22% 16% 73% 78% 4% 2% 82% 85% 1% 1% Seniors 1d. In your experience at your institution during the current school year, about how often have you worked on a paper or project that required integrating ideas or information from various sources? First-year Seniors NSSE, continued Classification UNI data for 2008 is the top figure; data for selected Carnegie peers is the bottom figure. 3c. During the current school year, about how many papers or reports of 20 pages or more have you written? First-year Seniors 3d. During the current school year, about how many papers or reports of between 5 and 19 pages have you written? First-year Seniors 3e. During the current school year, about how many papers or reports of fewer than 5 pages have you written? First-year Seniors LAC Skill Data for Communication, Fall 2008 Workshop More Than 20 11-20 5-10 1-4 None 0% 1% 1% 10% 88% 1% 1% 4% 11% 83% 1% 1% 3% 45% 50% 1% 2% 6% 38% 53% 1% 3% 23% 58% 14% 1% 4% 21% 57% 17% 2% 10% 33% 46% 8% 4% 10% 29% 46% 11% 9% 20% 38% 33% 1% 10% 19% 35% 33% 3% 21% 22% 26% 29% 2% 15% 19% 27% 34% 6% 2 Writing, Continued Self-Rating of Competence NSSE The top percentage is for the combined responses for very much or quite a bit; the lower percentage is the response for very little. Classification 2008 Carnegie 11c. To what extent has your experience at this institution contributed to your knowledge, skills, and personal development in writing clearly and effectively? First-year 72% 73% 1% 5% 76% 75% 2% 74% Seniors Graduating Student Survey (Seniors) The percentage is the combined responses for excellent or good. 2008 Rate how well UNI has prepared you for communicating through writing. (Q2) 84.4% MAPP—Scaled Scores Note: The upper scores in each row are the scores for entering freshmen (0 hours of credit completed) tested in Fall 2007; the lower scores are for seniors tested in Spring 2007. Possible Range Total Score Critical Thinking Reading Writing Mathematics 400 to 500 100 to 130 100 to 130 100 to 130 100 to 130 Mean Score 25th Percentile 50th Percentile 75th Percentile First-Year 441.70 430 439 451 Seniors 452.33 435 451 464 First-Year 110.87 106 110 115 Seniors 114.35 110 115 120 First-Year 116.89 111 118 122 Seniors 119.99 115 121 127 First-Year 113.89 111 114 117 Seniors 114.82 111 114 117 First-Year 113.68 110 113 117 Seniors 115.98 111 115 122 LAC Skill Data for Communication, Fall 2008 Workshop 3 MAPP—Proficiency Ratings ETS data for percentages of test-takers at each proficiency level are derived from MAPP testing of students in master’s (comprehensive) colleges and universities from July 2003 through July 2007. The UNI data is from entering freshmen (0 hours completed) taking MAPP in Fall 2007 and seniors taking MAPP in Spring 2007. PROFICIENCY CLASSIFICATION BY SKILL DIMENSION AND YEAR IN SCHOOL Proficient Skill Dimension Writing, Level 1 Writing, Level 2 Writing, Level 3 Marginal Not Proficient Year UNI ETS UNI ETS UNI ETS First-year 52% 55% 33% 29% 15% 15% Seniors 66% 71% 29% 21% 5% 8% First-year 16% 12% 31% 33% 53% 55% Seniors 17% 22% 41% 40% 42% 38% First-year 8% 5% 17% 21% 75% 75% Seniors 9% 9% 24% 32% 67% 59% MAPP Proficiency Classifications for Writing (http://www.ets.org/MAPP) To be considered Proficient at level 1 a student should be able to Recognize agreement among basic grammatical elements (e.g., nouns, verbs, pronouns and conjunctions) Recognize appropriate transition words Recognize incorrect word choice Order sentences in a paragraph Order elements in an outline To be considered Proficient at level 2 a student should be able to Incorporate new material into a passage Recognize agreement among basic grammatical elements (e.g., nouns, verbs, pronouns, and conjunctions) when these elements are complicated by intervening words or phrases Combine simple clauses into single, more complex combinations Recast existing sentences into new syntactic combinations To be considered Proficient at level 3 a student should be able to Discriminate between appropriate and inappropriate use of parallelism Discriminate between appropriate and inappropriate use of idiomatic language Recognize redundancy Discriminate between correct and incorrect constructions Recognize the most effective revision of a sentence LAC Skill Data for Communication, Fall 2008 Workshop 4


