Press Release
advertisement
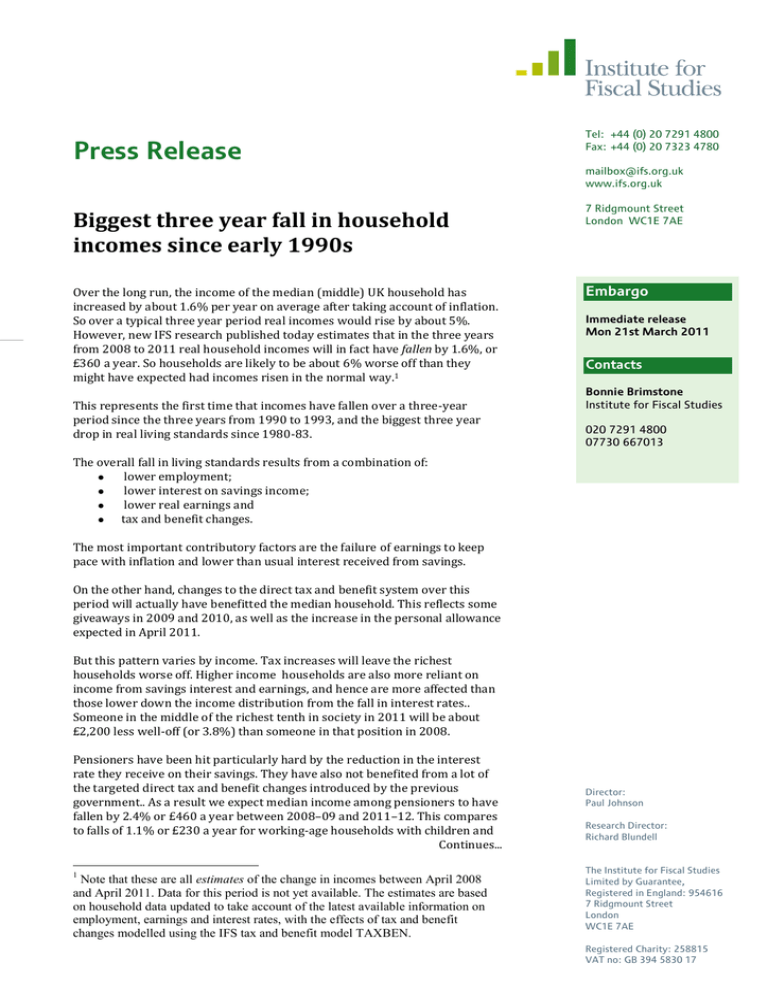
Press Release Tel: +44 (0) 20 7291 4800 Fax: +44 (0) 20 7323 4780 mailbox@ifs.org.uk www.ifs.org.uk Biggest three year fall in household incomes since early 1990s 7 Ridgmount Street London WC1E 7AE Over the long run, the income of the median (middle) UK household has increased by about 1.6% per year on average after taking account of inflation. So over a typical three year period real incomes would rise by about 5%. However, new IFS research published today estimates that in the three years from 2008 to 2011 real household incomes will in fact have fallen by 1.6%, or £360 a year. So households are likely to be about 6% worse off than they might have expected had incomes risen in the normal way.1 Embargo This represents the first time that incomes have fallen over a three-year period since the three years from 1990 to 1993, and the biggest three year drop in real living standards since 1980-83. Immediate release Mon 21st March 2011 Contacts Bonnie Brimstone Institute for Fiscal Studies 020 7291 4800 07730 667013 The overall fall in living standards results from a combination of: lower employment; lower interest on savings income; lower real earnings and tax and benefit changes. The most important contributory factors are the failure of earnings to keep pace with inflation and lower than usual interest received from savings. On the other hand, changes to the direct tax and benefit system over this period will actually have benefitted the median household. This reflects some giveaways in 2009 and 2010, as well as the increase in the personal allowance expected in April 2011. But this pattern varies by income. Tax increases will leave the richest households worse off. Higher income households are also more reliant on income from savings interest and earnings, and hence are more affected than those lower down the income distribution from the fall in interest rates.. Someone in the middle of the richest tenth in society in 2011 will be about £2,200 less well-off (or 3.8%) than someone in that position in 2008. Pensioners have been hit particularly hard by the reduction in the interest rate they receive on their savings. They have also not benefited from a lot of the targeted direct tax and benefit changes introduced by the previous government.. As a result we expect median income among pensioners to have fallen by 2.4% or £460 a year between 2008–09 and 2011–12. This compares to falls of 1.1% or £230 a year for working-age households with children and Continues... 1 Note that these are all estimates of the change in incomes between April 2008 and April 2011. Data for this period is not yet available. The estimates are based on household data updated to take account of the latest available information on employment, earnings and interest rates, with the effects of tax and benefit changes modelled using the IFS tax and benefit model TAXBEN. Director: Paul Johnson Research Director: Richard Blundell The Institute for Fiscal Studies Limited by Guarantee, Registered in England: 954616 7 Ridgmount Street London WC1E 7AE Registered Charity: 258815 VAT no: GB 394 5830 17 …continued falls of 1.8% or £500 a year for working-age households without children. This research was funded by the BBC and the ESRC Centre for the Microeconomic analysis of Public Policy at the IFS. James Browne, the author of the report, said: ‘We are used to the real purchasing power of our incomes increasing over time. It seems likely that in the three years from 2008to 2011 real incomes will have fallen. With real earnings growth slow, and more tax increases and benefit cuts to come, household incomes are likely to remain stagnant for some time to come. Household incomes will probably still be below their 2008 level in 2013. If so this will represent the biggest fall in incomes over a five year period since 1972-1977’. Figure 1: Effect of the recession on various percentiles of the income distribution, 2008–09 to 2011–12 Change in household income before housing costs 1% 0% -1% -2% -3% -4% Tax and benefit changes Real earnings Interest on savings Employment Overall -5% 5th 15th 25th 35th 45th 55th 65th 75th 85th 95th Median Percentile point of the income distribution The Institute for Fiscal Studies Limited by Guarantee, Registered in England: 954616 7 Ridgmount Street London WC1E 7AE Change in median household income before housing costs Figure 2: Effect of the recession on median income for different household types, 2008–09 to 2011–12 Real earnings Employment Overall Interest on savings Tax and benefit changes 1% 0% -1% -2% -3% Working age Pensioner Working age households with households households without children children Household type Overall median ENDS Notes to Editors: 1. ‘Living standards during the recession’ by James Browne will be published on st 21 March 2011. The full report will be available as a briefing note on the IFS website www.ifs.org.uk. For queries, contact: Bonnie Brimstone at IFS: 020 7291 4800, bonnie_b@ifs.org.uk. The Institute for Fiscal Studies Limited by Guarantee, Registered in England: 954616 7 Ridgmount Street London WC1E 7AE
