Session 2 Notes – reinforcement & reflection
advertisement
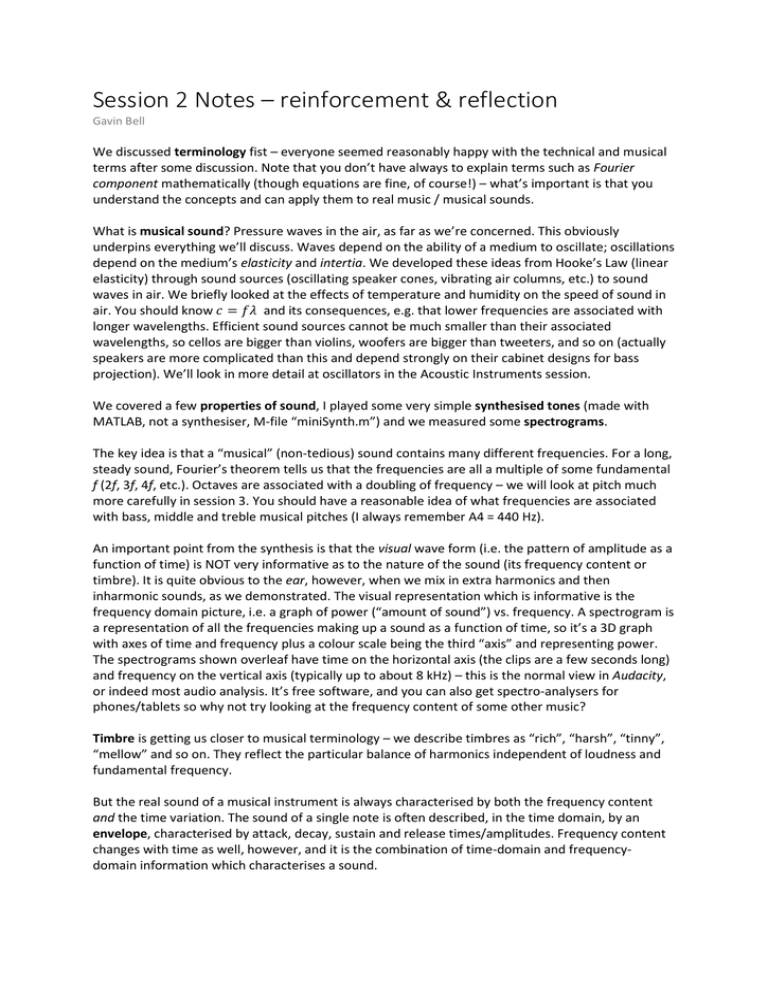
Session 2 Notes – reinforcement & reflection Gavin Bell We discussed terminology fist – everyone seemed reasonably happy with the technical and musical terms after some discussion. Note that you don’t have always to explain terms such as Fourier component mathematically (though equations are fine, of course!) – what’s important is that you understand the concepts and can apply them to real music / musical sounds. What is musical sound? Pressure waves in the air, as far as we’re concerned. This obviously underpins everything we’ll discuss. Waves depend on the ability of a medium to oscillate; oscillations depend on the medium’s elasticity and intertia. We developed these ideas from Hooke’s Law (linear elasticity) through sound sources (oscillating speaker cones, vibrating air columns, etc.) to sound waves in air. We briefly looked at the effects of temperature and humidity on the speed of sound in air. You should know 𝑐 = 𝑓𝜆 and its consequences, e.g. that lower frequencies are associated with longer wavelengths. Efficient sound sources cannot be much smaller than their associated wavelengths, so cellos are bigger than violins, woofers are bigger than tweeters, and so on (actually speakers are more complicated than this and depend strongly on their cabinet designs for bass projection). We’ll look in more detail at oscillators in the Acoustic Instruments session. We covered a few properties of sound, I played some very simple synthesised tones (made with MATLAB, not a synthesiser, M-file “miniSynth.m”) and we measured some spectrograms. The key idea is that a “musical” (non-tedious) sound contains many different frequencies. For a long, steady sound, Fourier’s theorem tells us that the frequencies are all a multiple of some fundamental f (2f, 3f, 4f, etc.). Octaves are associated with a doubling of frequency – we will look at pitch much more carefully in session 3. You should have a reasonable idea of what frequencies are associated with bass, middle and treble musical pitches (I always remember A4 = 440 Hz). An important point from the synthesis is that the visual wave form (i.e. the pattern of amplitude as a function of time) is NOT very informative as to the nature of the sound (its frequency content or timbre). It is quite obvious to the ear, however, when we mix in extra harmonics and then inharmonic sounds, as we demonstrated. The visual representation which is informative is the frequency domain picture, i.e. a graph of power (“amount of sound”) vs. frequency. A spectrogram is a representation of all the frequencies making up a sound as a function of time, so it’s a 3D graph with axes of time and frequency plus a colour scale being the third “axis” and representing power. The spectrograms shown overleaf have time on the horizontal axis (the clips are a few seconds long) and frequency on the vertical axis (typically up to about 8 kHz) – this is the normal view in Audacity, or indeed most audio analysis. It’s free software, and you can also get spectro-analysers for phones/tablets so why not try looking at the frequency content of some other music? Timbre is getting us closer to musical terminology – we describe timbres as “rich”, “harsh”, “tinny”, “mellow” and so on. They reflect the particular balance of harmonics independent of loudness and fundamental frequency. But the real sound of a musical instrument is always characterised by both the frequency content and the time variation. The sound of a single note is often described, in the time domain, by an envelope, characterised by attack, decay, sustain and release times/amplitudes. Frequency content changes with time as well, however, and it is the combination of time-domain and frequencydomain information which characterises a sound. Violin spectrogram, raising pitch then finishing on artificial harmonic. Rich harmonic content except for very pure final tone (black arrow). <<violin.wav>> Bass spectrogram - strongest below 500Hz (green arrow) as expected for bass, but lots of mid/high as the notes are struck (yellow arrows) due to the strong transient sounds. Remember, Fourier analysis tells us that a rapid change in the waveform (e.g. the sharp corner of a sawtooth wave or the rapid hit of a drum) MUST be represented by a lot of high frequency power (low frequency waves just don’t wobble rapidly enough). <<bass.wav>> Three recorders spectrogram with G being blown increasingly hard. Starts off with nice harmonic series, goes a little sharp then register shifts up in two stages (onsets shown by arrows). <<recorderhell.wav>> Finally, loudness is a basic parameter. This useful table (from Canadian govt. H&S) shows some nonmusical sound sources. We use a log scale because of the high range of sound pressures to which the ear can respond (a factor of a million: 20 × log10(1,000,000) = 120, the range of the scale). Here is a useful page on dB, dB(A) scales: http://www.animations.physics.unsw.edu.au/jw/dB.htm Make sure you understand the basics of these scales. The dB(A) scale accounts for the fact that the human ear is more sensitive to frequencies 1 – 4 kHz which therefore sound louder. Simple Excel exercise: try looking at decibels.xslx and plotting graphs of raw SPL and dB scale. You can also check the formula for the dB scale.

