Interactive Processing of Multi- and Hyper-spectral Environmental Satellite
advertisement
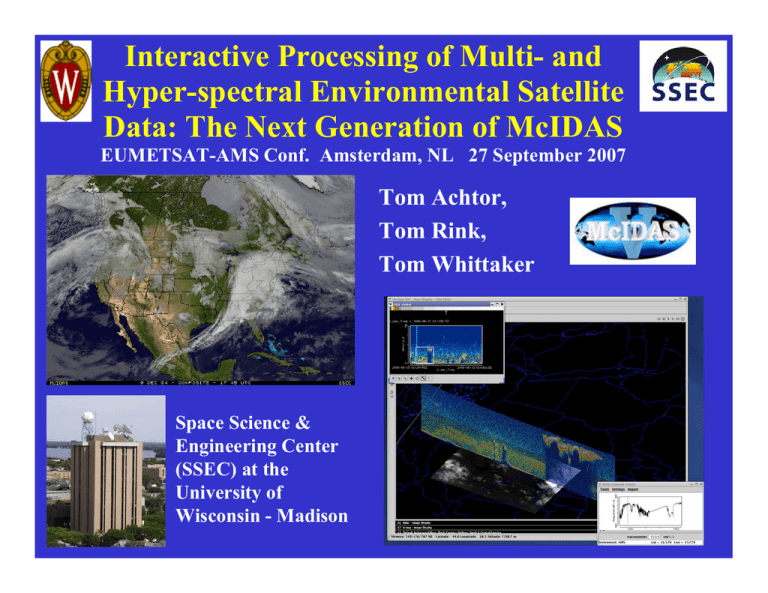
Interactive Processing of Multi- and Hyper-spectral Environmental Satellite Data: The Next Generation of McIDAS EUMETSAT-AMS Conf. Amsterdam, NL 27 September 2007 Tom Achtor, Tom Rink, Tom Whittaker Space Science & Engineering Center (SSEC) at the University of Wisconsin - Madison What is McIDAS ? (Man computer Interactive Data Access System) • Collection of user programs and libraries for visualizing and analyzing geophysical data (focus on environmental satellites) – UNIX, PC & Mac capable • A synergistic tool that integrates numerous data types into one system • First developed in the early 1970s • Still in use world-wide at research, operational, educational, and commercial sites Key McIDAS-X Attributes • Access to extensive geophysical database • Core package (MUG supported) plus user-written applications • Diverse functionality through software (1 million + lines of code) • Extensive 2-D visualization capabilities • Satellite and NOAAPORT data ingest McIDAS-X Functionality • Digital Image Processing • GIS Applications • Weather and Climate Data Analysis and Applications • Graphical Displays of Data & Information • Gridded Data Processing and Analysis Tools • Display & Process Control Utilities • Interactive and Background Processing McIDAS-X Users • NOAA – NESDIS, AWC, SPC, TPC, etc. • NASA – STS, LaRC, MSFC, JPL • Unidata – 130 universities, colleges and international educational collaborators • International – EUMETSAT, Spain, Greece, Mexico, Australia • Industry –Honeywell, Weathernews, Universal Weather, Meteorlogix, Weather Central, etc. Why the Change? • Forthcoming GOES-R & NPOESS operational satellite data cannot be optimally utilized – great increase in data rates – new tools for working with these large data sets • McIDAS software (written in Fortran 77 and C) has a 30+ year heritage resulting in limited extensibility potential • Platform / OS dependence • New data analysis and visualization concepts are now available (e.g. 4-D) McIDAS-V Functionality McIDAS-V will be a collection of software tools, and networked services and data designed to take advantage of a scalable distributed computing environment to meet user needs • Full support for McIDAS-X • OpenDap / OpenADDE • Open GIS Consortium • Database archives • Cluster computing • McIDAS-V will be open source and freely available What is McIDAS-V McIDAS-X Æ VisAD + IDV + HYDRA = McIDAS-V VisAD Developer: Bill Hibbard, UW SSEC • Open-source, Java library for building interactive and collaborative visualization and analysis tools • Features include: – Powerful mathematical data model that embraces virtually any numerical data set – General display model that supports 2- and 3-D displays, multiple data views, direct manipulation – Adapters for multiple data formats (netCDF, HDF-5, FITS, HDF-EOS, McIDAS, Vis5D, etc.) and access to remote data servers through HTTP, FTP, DODS/OpenDAP, and OpenADDE protocols – Metadata can be integrated into each data object What is the IDV? • Unidata developed, VisADbased, scientific analysis and visualization library and toolkit • Open Source, Java™ framework and reference application • Provides 2- and 3-D displays of geo-scientific data (plus, of course, animations) • Stand-alone or networked application http://www.unidata.ucar.edu/idv HYDRA enables interrogation of multispectral and hyperspectral fields of data – Individual pixel location and spectral band measurements can be easily displayed – spectral channels can be combined in linear functions and the resulting images displayed – false color images can be constructed from multiple channel combinations – scatter plots of spectral channel combinations can be viewed – pixels in images can be found in scatter plots and vice versa – transects of measurements can be displayed – L2 products; e.g. soundings of temperature and moisture as well as spectra from selected pixels can be compared – integrated data exploration and analysis between GEO and POLAR observing platforms AIRS Cirrus vs Clear Sky Spectra Mt Etna viewed by AIRS 28 Oct 2002 SO2 signal 1284-1345 cm-1 Inferring ash cloud height from AIRS clear sky and in ash soundings Ash cloud and clear sky spectra Offline-Online in LW CO2 Offline-Online in H2O What is McIDAS-V McIDAS-X Æ VisAD + IDV + HYDRA = McIDAS-V The “X to V” Bridge • Interacts with a McIDAS-X remote session • Users provides command line input in a McIDAS-V Data Chooser that sends commands to a server running McIDAS-X • Runs all McIDAS-X commands, including status, text, imagery and graphics – McIDAS-X output displayed in McIDAS-V • Allows bi-directional interactive communication between McIDAS-V and McIDAS-X The “X to V” Bridge The “X to V” Bridge McIDAS-V is a collection of software tools, and networked services and data designed to take advantage of a scalable distributed computing environment to meet user needs GIS Cluster OpenDAP/ computing ADDE McIDAS-V GeoCAT Database/ McIDAS-X SAN Matlab/IDL Origami Experiment Goals • Visualization of meteorological fields from very large simulated model and retrieved data sets • Remotely query a large database to obtain the required data from a Storage Area Network (SAN) and load into an application (the task) • Invoke the task on a cluster computer, reading from the database and writing results to a temporary file • Informing the user where the output data resides (e.g. bring the result into McIDAS-V) The Origami Experiment Viewing multiple data blocks (cubes or granules) as part of a single visualization request across a larger geographic area. McIDAS-V Transition Plan • Built upon the existing capabilities of VisAD/IDV • Incorporate the functionality of the Hyperspectral Data for Research Analysis (HYDRA) toolkit • Allows McIDAS-X heritage code to be usable in the new environment without a need to rewrite – ‘Bridge’ software allows McIDAS-X commands to be submitted from the McIDAS-V display • Provides a new environment for developing algorithms and new visualizations that take advantage of multi and hyper-spectral data from emerging observing systems McIDAS-V Future Work • Complete HYDRA integration • Complete development of the ‘X to V Bridge’ to provide an evolutionary path for MUG into McIDAS-V (October 2007) – Alpha 1.0 release at 10/2007 MUG meeting • Support the development of applications for the NPP/NPOESS and GOES R science teams (ongoing) – Data management and accessibility – Broad array of formats and services – Advanced analysis and visualization tools Interactive Processing of Multi- and Hyper-spectral Environmental Satellite Data: The Next Generation of McIDAS EUMETSAT-AMS Conf. Amsterdam, NL 27 September 2007 Tom Achtor, Tom Rink, Tom Whittaker Space Science & Engineering Center (SSEC) at the University of Wisconsin - Madison
