Michigan Technological University Higher Education Act Disclosures Fall 2009 Full‐time Freshmen Cohort Graduation and Transfer‐Out Rates
advertisement
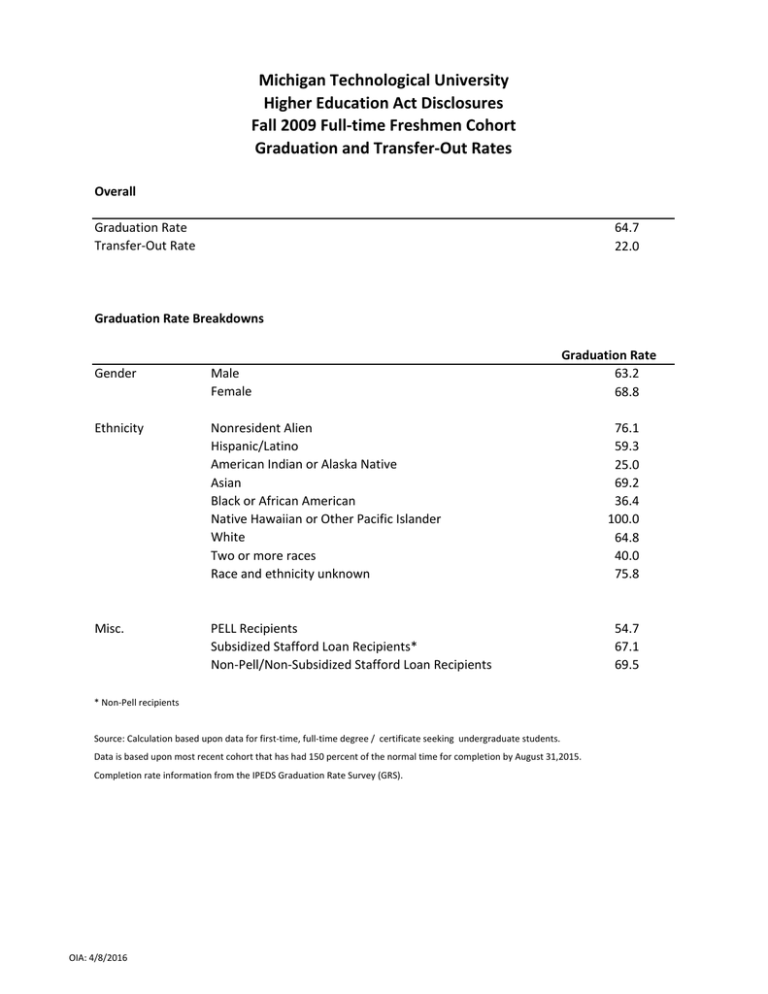
Michigan Technological University Higher Education Act Disclosures Fall 2009 Full‐time Freshmen Cohort Graduation and Transfer‐Out Rates Overall Graduation Rate Transfer‐Out Rate 64.7 22.0 Graduation Rate Breakdowns Gender Male Female Ethnicity Nonresident Alien Hispanic/Latino American Indian or Alaska Native Asian Black or African American Native Hawaiian or Other Pacific Islander White Two or more races Race and ethnicity unknown Misc. PELL Recipients Subsidized Stafford Loan Recipients* Non‐Pell/Non‐Subsidized Stafford Loan Recipients Graduation Rate 63.2 68.8 * Non‐Pell recipients Source: Calculation based upon data for first‐time, full‐time degree / certificate seeking undergraduate students. Data is based upon most recent cohort that has had 150 percent of the normal time for completion by August 31,2015. Completion rate information from the IPEDS Graduation Rate Survey (GRS). OIA: 4/8/2016 76.1 59.3 25.0 69.2 36.4 100.0 64.8 40.0 75.8 54.7 67.1 69.5
