Melting of Tin at High Pressures B. Kiefer, T.S. Duffy, T. Uchida,
advertisement

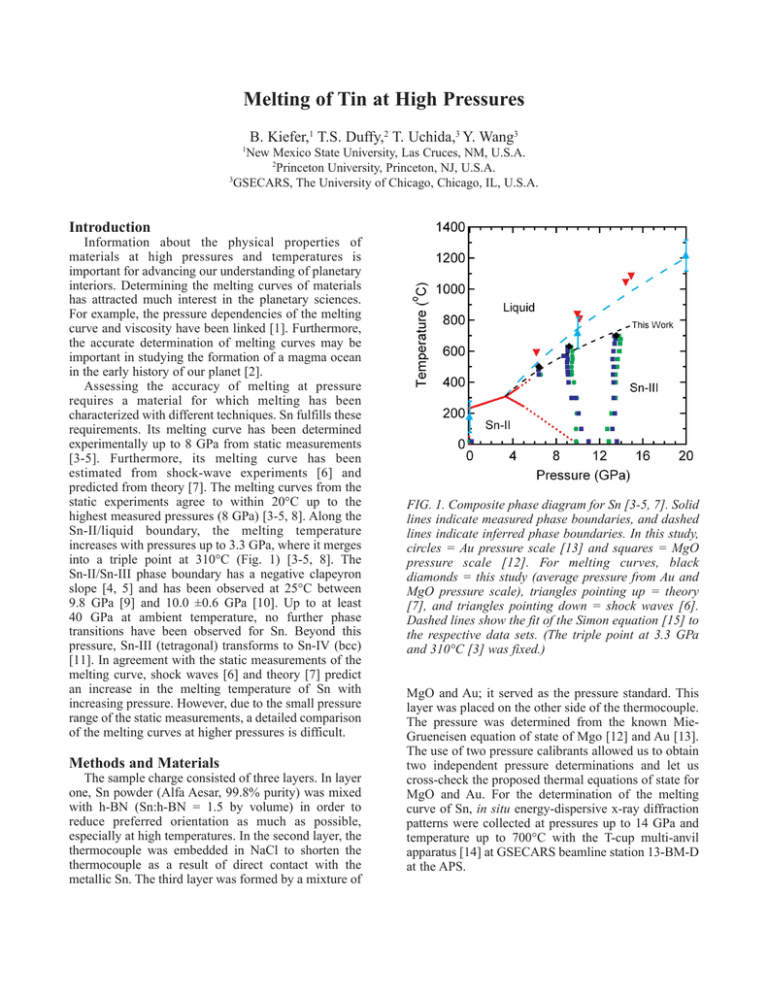
Melting of Tin at High Pressures B. Kiefer,1 T.S. Duffy,2 T. Uchida,3 Y. Wang3 1 New Mexico State University, Las Cruces, NM, U.S.A. 2 Princeton University, Princeton, NJ, U.S.A. 3 GSECARS, The University of Chicago, Chicago, IL, U.S.A. Introduction Information about the physical properties of materials at high pressures and temperatures is important for advancing our understanding of planetary interiors. Determining the melting curves of materials has attracted much interest in the planetary sciences. For example, the pressure dependencies of the melting curve and viscosity have been linked [1]. Furthermore, the accurate determination of melting curves may be important in studying the formation of a magma ocean in the early history of our planet [2]. Assessing the accuracy of melting at pressure requires a material for which melting has been characterized with different techniques. Sn fulfills these requirements. Its melting curve has been determined experimentally up to 8 GPa from static measurements [3-5]. Furthermore, its melting curve has been estimated from shock-wave experiments [6] and predicted from theory [7]. The melting curves from the static experiments agree to within 20°C up to the highest measured pressures (8 GPa) [3-5, 8]. Along the Sn-II/liquid boundary, the melting temperature increases with pressures up to 3.3 GPa, where it merges into a triple point at 310°C (Fig. 1) [3-5, 8]. The Sn-II/Sn-III phase boundary has a negative clapeyron slope [4, 5] and has been observed at 25°C between 9.8 GPa [9] and 10.0 ±0.6 GPa [10]. Up to at least 40 GPa at ambient temperature, no further phase transitions have been observed for Sn. Beyond this pressure, Sn-III (tetragonal) transforms to Sn-IV (bcc) [11]. In agreement with the static measurements of the melting curve, shock waves [6] and theory [7] predict an increase in the melting temperature of Sn with increasing pressure. However, due to the small pressure range of the static measurements, a detailed comparison of the melting curves at higher pressures is difficult. Methods and Materials The sample charge consisted of three layers. In layer one, Sn powder (Alfa Aesar, 99.8% purity) was mixed with h-BN (Sn:h-BN = 1.5 by volume) in order to reduce preferred orientation as much as possible, especially at high temperatures. In the second layer, the thermocouple was embedded in NaCl to shorten the thermocouple as a result of direct contact with the metallic Sn. The third layer was formed by a mixture of FIG. 1. Composite phase diagram for Sn [3-5, 7]. Solid lines indicate measured phase boundaries, and dashed lines indicate inferred phase boundaries. In this study, circles = Au pressure scale [13] and squares = MgO pressure scale [12]. For melting curves, black diamonds = this study (average pressure from Au and MgO pressure scale), triangles pointing up = theory [7], and triangles pointing down = shock waves [6]. Dashed lines show the fit of the Simon equation [15] to the respective data sets. (The triple point at 3.3 GPa and 310°C [3] was fixed.) MgO and Au; it served as the pressure standard. This layer was placed on the other side of the thermocouple. The pressure was determined from the known MieGrueneisen equation of state of Mgo [12] and Au [13]. The use of two pressure calibrants allowed us to obtain two independent pressure determinations and let us cross-check the proposed thermal equations of state for MgO and Au. For the determination of the melting curve of Sn, in situ energy-dispersive x-ray diffraction patterns were collected at pressures up to 14 GPa and temperature up to 700°C with the T-cup multi-anvil apparatus [14] at GSECARS beamline station 13-BM-D at the APS. and simulations [9] increase rapidly and reach ≈20% at 14 GPa (Fig. 1). Our study expands the melting curve of Sn by a factor of almost two. It is hoped that these results will provide new input and guidance for computational methodologies that calculate the melting curve as well as for the determination of melting curves from shockwave experiments. Acknowledgments This research was supported by the National Science Foundation. Use of the APS was supported by the U.S. Department of Energy, Office of Science, Office of Basic Energy Sciences, under Contract No. W-31-109ENG-38. References FIG. 2. Melting of tin at high pressure. Representative spectra of the Sn-III phase up to melting. The sample was heated at a constant ram load of 80 tons. The sample peaks are labeled with their Miller indices; the only other peaks arise from h-BN. Results and Discussion At pressures above 10.7 ±0.5 GPa and ambient temperature, we observed x-ray diffraction peaks of only the Sn-III phase (Fig. 2). The transition pressure is an upper bound for the Sn-II/Sn-III transition, since no reversal was attempted. Nevertheless, the determined transition pressure is consistent with previous determinations of the Sn-II/Sn-III phase boundary, between 9.8 GPa [9] and 10.0 ±0.6 GPa [10]. The sample was further compressed and finally heated. During heating, only the Sn-III phase was observed. At temperatures close to the melting temperature, the intensity of the x-ray peaks decreased, and, simultaneously, the background increased as expected (Fig. 2). The observation of melting itself displays a time dependence most likely related to the nucleation of the liquid phase (Fig. 2). Once the melt formed, all attempts to recover the solid Sn-III phase failed, and it was impossible to establish tighter bounds for the melting temperatures. The MgO and Au pressures for the melting temperatures of Sn agree to within 0.5 GPa. The melting temperature increases beyond the triple point, in agreement with previous studies [3-5, 8, 9]. However, the discrepancies between shock waves [8] [1] J. Weertmann and J.R. Weertmann, Ann. Rev. Earth Pl. Sc. 3, 293-315 (1975). [2] C.B. Agee, J. Geophys. Res. 98, 5317 (1993). [3] J.D. Dudley and H.T. Hall, Phys. Rev. 118, 12111216 (1960). [4] G.C. Kennedy and R.C. Newton, in Solids under Pressure, edited by W. Paul and D.M. Warschauer, (1963) pp. 163-178. [5] J.D. Barnett, R.B. Bennion, and H.T. Hall, Science 141, 1041-1042 (1963). [6] C. Mabire and P.L. Héreil, in Proceedings of the APS Conference on Shock Compression of Condensed Matter, edited by M.D. Furnish, L.C. Chabildar, and R.S. Hixon, 505, 93 (1999). [7] S. Bernard and J.B. Maillet, Phys. Rev. B 66, 012103 (2002). [8] L.-G. Liu and W.A. Bassett, “Elements, oxides, silicates,” Oxford Monographs on Geology and Geophysics 4 (Oxford University Press, 1986), p. 39. [9] J.D. Barnett, V.E. Bean, and H.T. Hall, J. Appl. Phys. 37, 875-877 (1966). [10] H.T. Hall, in Accurate Characterization of the High Pressure Environment, edited by E.D. Lloyd (1971), pp. 313-314. [11] H. Olijnyk and W.B. Holzapfel, J. de Physique C 8, 153-156 (1984). [12] S. Speziale, C.-S. Zha, T.S. Duffy, R.J. Hemley, and H.-K. Mao, J. Geophys. Res. 106, 515-528 (2001). [13] S.-H. Shim, T.S. Duffy, and T. Kenichi, Earth Planet. Sc. Lett. 203, 729-739 (2002). [14] T. Uchida, Y. Wang, M.L. Rivers, and S.R. Sutton, J. Geophys. Res. 106, 21799 (2001). [15] F. Simon and G. Glatzel, Z. Anorg. Allg. Chem. 178, 309-316 (1929).


