Document 12712103
advertisement
International Workshop on Synchrotron High-Pressure Mineral
Physics and Material Science
The Advanced Photon Source, ANL - Dec. 6-7, 2007
X-ray Microtomography at High Pressure
Charles E. Lesher, Sarah Gaudio, Alisha Clark (UC Davis)
Yanbin Wang, Nori Nishiyama1 and Mark Rivers (GSECARS-APS)
(1Now at: Geodyn. Res. Center, Ehime U., Japan)
GeoSoilEnviroCARS-APS
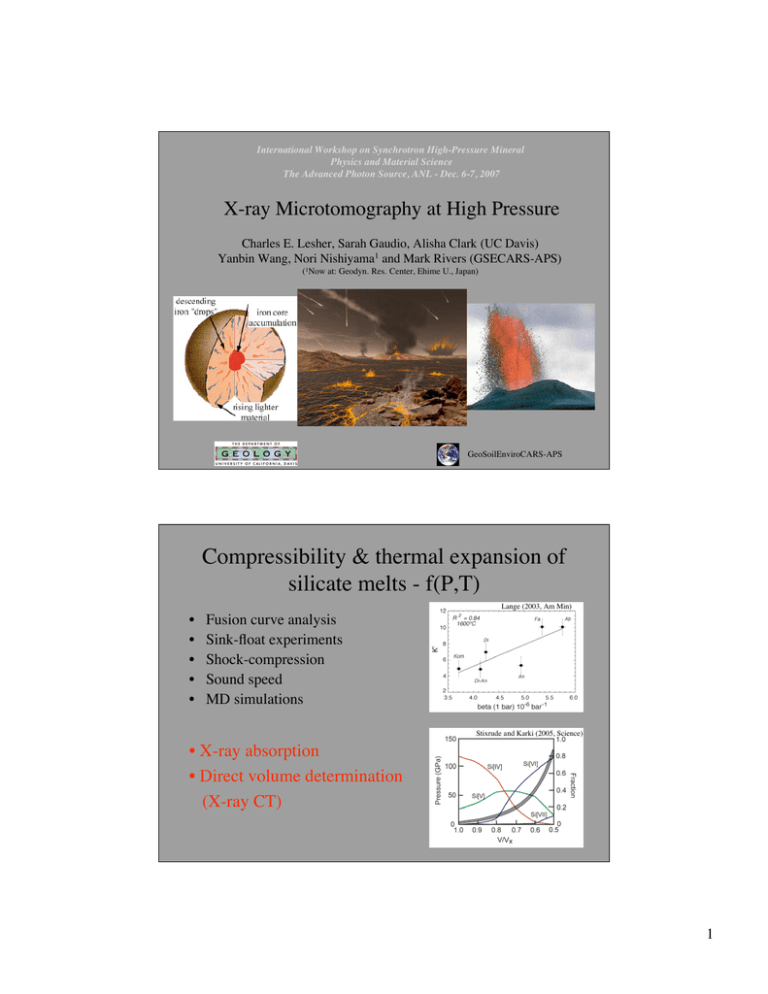
Compressibility & thermal expansion of
silicate melts - f(P,T)
Lange (2003, Am Min)
•
•
•
•
•
Fusion curve analysis
Sink-float experiments
Shock-compression
Sound speed
MD simulations
Stixrude and Karki (2005, Science)
• X-ray absorption
• Direct volume determination
(X-ray CT)
1
Instrument Requirements
• Panoramic X-ray access under pressure
• At least 180° sample rotation, under
250 T press frame
pressure
Die set
• Ability to use various pressure cells
• Bulk characterization (at least mm
Harmonic
Drive
sized samples)
Transport
Rails
• High temperature capability
• Deformation capability
• Mono- and polychromatic X-rays
Hydraulic
ram
Wang, Y., T. Uchida, F. Westferro, M.L. Rivers, N. Nishiyama, J. Gebhardt, C.E. Lesher,
S.R. Sutton (2005) High-Pressure X-ray Tomography Microscope: Synchrotron Computed
Microtomography at High Pressure and Temperature, Rev. Sci. Instrum., 76, 073709, doi:
10.1063/1.1979477.
Rotating Anvil Apparatus (RAA)
13-BM-D, GSECARS-APS
•Mono energy: 35-50 keV
•Pixel size: ~1.5-2 microns unbinned; 3-4 microns 2x2
binned
•Exposure times: 30 s unbinned; ~10 s 2x2 binned
•Rotation range: 0°-179.5° (0.5°;steps)
•Dark current/white field images collected before and
after data collection, horizontally 3 – 4 mm from the
sample center through borated epoxy and containment
ring
803 µm
Containment
ring
CCD
2mm
Side view
objective
Mono 2nd crystal
SSD
Phosphor
assembly
Slits
Sample
In LVP
Mono 1st crystal
polychromatic
radiation
mono mode
white mode
13-BM-D Sector 13
2
Computed Tomography
0o
Radon transform
Back Projection
Radiograph
179.5o
Signogram
2-D map of µL
Beer-Lambert law: dI/I = -µLdx
I = Io exp(-µLx)
Io - intensity of unattenuated radiation
I - intensity of transmitted flux after traversing
thickness x
µL - linear attenuation coef. = mass absorption
coef (µm)* mass density(ρ)
Rendered
volume
Spatial resolution test – Blob3d extraction
2
Inclusion surface, mm
Inclusion surface area, mm2
r = 0.1mm
0.1
0.01
spheres
r = 0.01 mm
cubes
0.001
1e-5
1e-4
1e-3
1e-2
3
Inclusion volume, mm
Wang et al. (2005)
3
Image Processing and Resolution
Filters
unmodified
Un mo difi e d
2 Pixel Median
2 P ixe l Med ian
2 Pixel Mean
2 P ixe l Me an
2 Pixel Gaussian
2 P ixe l Gau ss ian
4 µm pixel
2 µm
1 µm
38% SiO2
v-Fo
Ko = 90 GPa
Ko = 80 GPa
K' = 3-6
3rd order Birch-Murnaghan EOS
P = (3/2)KT, 0[(VT, 0/V)7/3 - (VT, 0/V)5/3]{1 – (3/4)(4-K’T, 0)[(VT, 0/V)2/3-1]}
4
Direct volume determination:
But, there is another way:
Absorption:
µL = µM∗ρ
Requires in situ calibration:
CT-number = 1000*[(µ’L,i - µ’L,std)/µ’L,std)]
I /Io= exp(-µLx)
5
Calibration
µL (cm-1)
FeS
NaCl
38%SiO2
Ko = 90 GPa
Ko = 80 GPa
4.7 GPa
(15 ton)
µL
(cm-1)
µM
(cm2g-1)
ρ
(g cm-3)
FeS
9.756
1.891
5.16
NaCl
1.584
0.624
2.54
38%SiO2
1.074
0.354
3.03
(3.04)
K' = 3-6
Melt properties by HPXMT
spinifex in komatiite
6
A possible strategy for refractory melts
1 atm
V
Can we detect changes in volume
(density) passing through Tg at
pressure by HPXCT?
h-P
T
Experimental Design
High T Drickamer Cell
2 GPa
Anvil
FeS
FeS
FeS
Cu foil
BE
BN
v-En
BE
BN
800º C/2 GPa
FeS
Anvil
0
1
2
Scale (mm)
7
1 atm Tg
MgSiO3
2 GPa
Present and Future for HPXMT
•
P-V-T relations glasses/melts
- Direct volume determination
- Density from absorption
•
Other applications
- Textural/phase relations
- Partial melting
- Deformation
- among others
•
Diffraction/scattering
- Monochromatic mode
- CAESAR mode
•
•
Ultrasonics
Neutrons
Dunite + FeS melt
8
