Rapid Assessment Reference Condition Model
advertisement
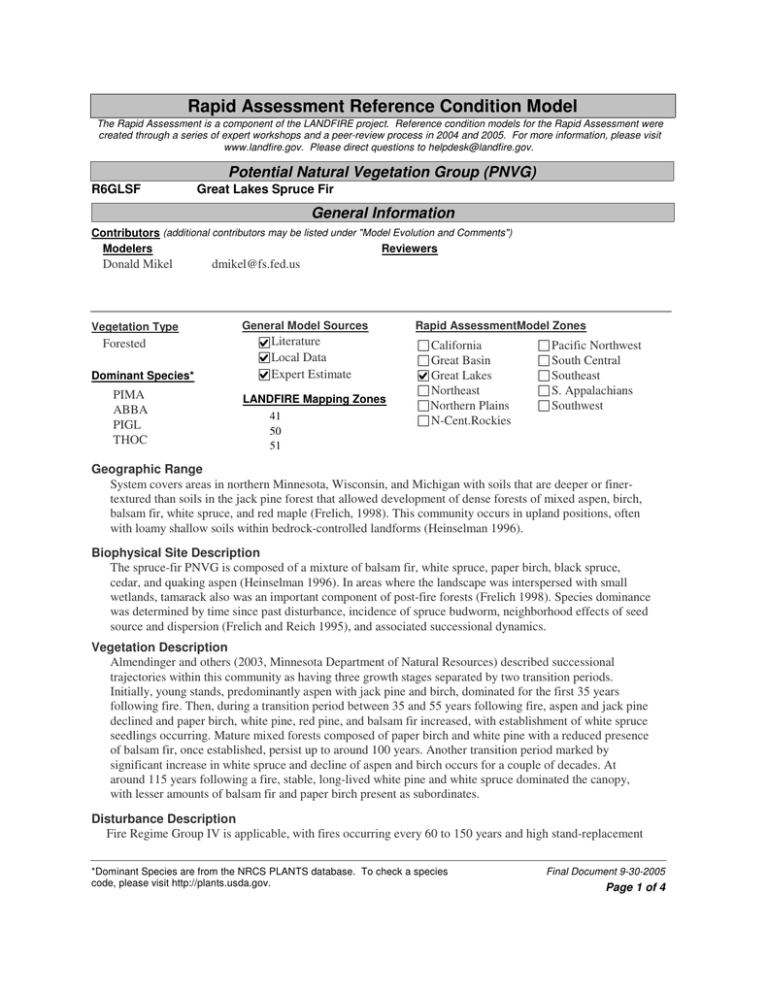
Rapid Assessment Reference Condition Model The Rapid Assessment is a component of the LANDFIRE project. Reference condition models for the Rapid Assessment were created through a series of expert workshops and a peer-review process in 2004 and 2005. For more information, please visit www.landfire.gov. Please direct questions to helpdesk@landfire.gov. R6GLSF Potential Natural Vegetation Group (PNVG) Great Lakes Spruce Fir General Information Contributors (additional contributors may be listed under "Model Evolution and Comments") Modelers Reviewers Donald Mikel Vegetation Type Forested Dominant Species* PIMA ABBA PIGL THOC dmikel@fs.fed.us General Model Sources Literature Local Data Expert Estimate LANDFIRE Mapping Zones 41 50 51 Rapid AssessmentModel Zones California Great Basin Great Lakes Northeast Northern Plains N-Cent.Rockies Pacific Northwest South Central Southeast S. Appalachians Southwest Geographic Range System covers areas in northern Minnesota, Wisconsin, and Michigan with soils that are deeper or finertextured than soils in the jack pine forest that allowed development of dense forests of mixed aspen, birch, balsam fir, white spruce, and red maple (Frelich, 1998). This community occurs in upland positions, often with loamy shallow soils within bedrock-controlled landforms (Heinselman 1996). Biophysical Site Description The spruce-fir PNVG is composed of a mixture of balsam fir, white spruce, paper birch, black spruce, cedar, and quaking aspen (Heinselman 1996). In areas where the landscape was interspersed with small wetlands, tamarack also was an important component of post-fire forests (Frelich 1998). Species dominance was determined by time since past disturbance, incidence of spruce budworm, neighborhood effects of seed source and dispersion (Frelich and Reich 1995), and associated successional dynamics. Vegetation Description Almendinger and others (2003, Minnesota Department of Natural Resources) described successional trajectories within this community as having three growth stages separated by two transition periods. Initially, young stands, predominantly aspen with jack pine and birch, dominated for the first 35 years following fire. Then, during a transition period between 35 and 55 years following fire, aspen and jack pine declined and paper birch, white pine, red pine, and balsam fir increased, with establishment of white spruce seedlings occurring. Mature mixed forests composed of paper birch and white pine with a reduced presence of balsam fir, once established, persist up to around 100 years. Another transition period marked by significant increase in white spruce and decline of aspen and birch occurs for a couple of decades. At around 115 years following a fire, stable, long-lived white pine and white spruce dominated the canopy, with lesser amounts of balsam fir and paper birch present as subordinates. Disturbance Description Fire Regime Group IV is applicable, with fires occurring every 60 to 150 years and high stand-replacement *Dominant Species are from the NRCS PLANTS database. To check a species code, please visit http://plants.usda.gov. Final Document 9-30-2005 Page 1 of 4 severity. Severe stand-replacing wind events affect mature stands on an approximate 1,000-year interval. Adjacency or Identification Concerns Scale Description Sources of Scale Data Literature Local Data Expert Estimate Issues/Problems Wisconsin and Michigan would include hemlock in the PNVG. Hemlock does not occur in the Minnesota system. Model Evolution and Comments Wisconsin and Michigan added to Minnesota, and white pine added to late-seral condition. All other information transferred directly from reference condition modeled by Cleland, Merzenich, Swaty. Suggested reviewers include David Cleland, Jim Merzenich, and Randy Swaty. Succession Classes** Succession classes are the equivalent of "Vegetation Fuel Classes" as defined in the Interagency FRCC Guidebook (www.frcc.gov). Class A 30 % Early1 All Struct Description Class A: Early-seral aspen-birch < 40 years. Class A succeeds to midage stands (Class B). Dominant Species* and Canopy Position POTR5 Upper BEPA Upper 35 % Mid1 All Structu Description Class B: Mid-age with aspen-birch overstory and mid-tolerant understory (40-100 year. Succeeds to class C. Replacement fires result in aspen-birch. Windthrow returns vegetation to the beginning of this class. Min 0% Cover Height Tree Regen <5m Tree Size Class Upper Layer Lifeform Herbaceous Shrub Tree Fuel Model Class B Structure Data (for upper layer lifeform) Upper Upper Low-Mid Low-Mid Upper Layer Lifeform Herbaceous Shrub Tree Fuel Model Tree Tall 25-49m no data Upper layer lifeform differs from dominant lifeform. Height and cover of dominant lifeform are: 9 Dominant Species* and Canopy Position POTR5 BEPA ABBA PIGL Max 100 % Structure Data (for upper layer lifeform) Min 0% Cover Height Tree Regen <5m Tree Size Class Max 100 % Tree Tall 25-49m no data Upper layer lifeform differs from dominant lifeform. Height and cover of dominant lifeform are: 8 *Dominant Species are from the NRCS PLANTS database. To check a species code, please visit http://plants.usda.gov. Final Document 9-30-2005 Page 2 of 4 Class C 25 % Mid2 Closed Description Class C: Mid-age stands dominated by white spruce and balsam fir (101-200 years). Succeeds to class D. Higher replacement fire probabilities are due to effects of spruce budworm. Class D 10 % Late1 Closed Description Class D: Old stands > 200 years. End point of succession. Spruce budworm increases replacement fire probability. Dominant Species* and Canopy Position PIGL Upper ABBA Upper PIMA Upper Upper Layer Lifeform Herbaceous Shrub Tree Fuel Model Upper Upper Upper Upper Upper Layer Lifeform Herbaceous Shrub Tree Fuel Model Class E 0% Min 75 % Cover Height Tree Regen <5m Tree Size Class Tree Tall 25-49m no data Upper layer lifeform differs from dominant lifeform. Height and cover of dominant lifeform are: Structure Data (for upper layer lifeform) Min 75 % Cover Height Tree Regen <5m Tree Size Class Max 100 % Tree Tall 25-49m no data Upper layer lifeform differs from dominant lifeform. Height and cover of dominant lifeform are: 8 Dominant Species* and Canopy Position Late1 All Structu Structure Data (for upper layer lifeform) Min Cover Description Height Tree Size Class Upper Layer Lifeform Herbaceous Shrub Tree Fuel Model Max 100 % 8 Dominant Species* and Canopy Position PIGL ABBA PIMA PIST Structure Data (for upper layer lifeform) % no data Max % no data no data Upper layer lifeform differs from dominant lifeform. Height and cover of dominant lifeform are: no data Disturbances *Dominant Species are from the NRCS PLANTS database. To check a species code, please visit http://plants.usda.gov. Final Document 9-30-2005 Page 3 of 4 Disturbances Modeled Fire Insects/Disease Wind/Weather/Stress Native Grazing Competition Other: Other Historical Fire Size (acres) Avg: no data Min: 10 Max: 10000 Sources of Fire Regime Data Literature Local Data Expert Estimate Fire Regime Group: 4 I: 0-35 year frequency, low and mixed severity II: 0-35 year frequency, replacement severity III: 35-200 year frequency, low and mixed severity IV: 35-200 year frequency, replacement severity V: 200+ year frequency, replacement severity Fire Intervals (FI) Fire interval is expressed in years for each fire severity class and for all types of fire combined (All Fires). Average FI is central tendency modeled. Minimum and maximum show the relative range of fire intervals, if known. Probability is the inverse of fire interval in years and is used in reference condition modeling. Percent of all fires is the percent of all fires in that severity class. All values are estimates and not precise. Replacement Mixed Avg FI Min FI 85 50 Max FI Probability 200 0.01176 Percent of All Fires 100 Surface All Fires 85 0.01178 References All information transferred from Fire Regime Condition Class (FRCC) Interagency Handbook Reference Conditions. Modelers Davic Cleland, Jim Merzenich, Randy Swaty, Great Lakes Spruce-Fir. *Dominant Species are from the NRCS PLANTS database. To check a species code, please visit http://plants.usda.gov. Final Document 9-30-2005 Page 4 of 4
