Document 12624981
advertisement

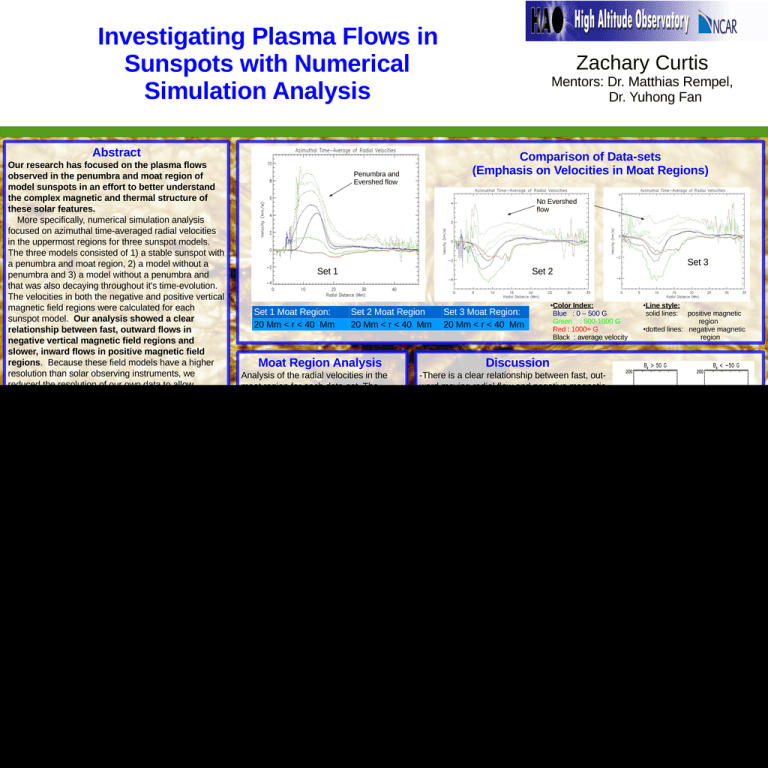
Investigating Plasma Flows in Sunspots with Numerical Simulation Analysis Abstract Our research has focused on the plasma flows observed in the penumbra and moat region of model sunspots in an effort to better understand the complex magnetic and thermal structure of these solar features. More specifically, numerical simulation analysis focused on azimuthal time-averaged radial velocities in the uppermost regions for three sunspot models. The three models consisted of 1) a stable sunspot with a penumbra and moat region, 2) a model without a penumbra and 3) a model without a penumbra and that was also decaying throughout it's time-evolution. The velocities in both the negative and positive vertical magnetic field regions were calculated for each sunspot model. Our analysis showed a clear relationship between fast, outward flows in negative vertical magnetic field regions and slower, inward flows in positive magnetic field regions. Because these field models have a higher resolution than solar observing instruments, we reduced the resolution of our own data to allow observers to compare to our data. Essentially, the same results were found. We also examined the believed connection between the horizontal outward flows in the penumbra (Evershed flow) and the MMF activity in the moat region of the sun. We found that type 3 MMFs--a fast moving, unipolar, opposite polarity moving magnetic feature--appear to have no connection to the Evershed flow. Also, the moderate moat flow observed is actually a result of granulation and geometric effects. Mentors: Dr. Matthias Rempel, Dr. Yuhong Fan Comparison of Data-sets (Emphasis on Velocities in Moat Regions) Penumbra and Evershed flow No Evershed flow Set 1 Set 1 Moat Region: 20 Mm < r < 40 Mm Set 3 Set 2 Set 2 Moat Region 20 Mm < r < 40 Mm Moat Region Analysis Analysis of the radial velocities in the moat region for each data-set. The average velocity for different magnetic “bins” was calculated from -3000 G to 3000 G. A better description of the dependence of radial velocity on field strength and polarity was show when looking at bins from -1000 G to 1000G, since most of the area of the sunspot falls in this region. Background Information Sunspots consists of three main regions: 1)Umbra: Dark, central region with strong vertical magnetic fields that suppress the transport of energy by convection. 2)Penumbra: Filamentary structure surrounding the umbra. It has a two-component magnetic structure with alternating vertical and horizontal magnetic fields. A long know Evershed flow carries plasma radially outward at several km/s. Some scientists believe that moat region moving magnetic features (MMFs) are driven by the Evershed Flow . This is still debated. 3)Moat: The region immediately surrounding the penumbra.. MMFs move radially outward in this region, and Pores (very small sunspot-like features) can develop From Vacuum Tower Telescope, NSO, NOAO, via http://antwrp.gsfc.nasa.gov/apod/ap051106.html here as well. Zachary Curtis Proposed Origin of To understand our results, we considered the geometry of our observations and the upward And downward convection cells. See right. Regions of negative polarity preferentially reside on the granule side facing away from the sunspot. The plot on the far right confirms that a (-) region on the far side of a sunspot should have a negative dI/dr value. Set 3 Moat Region: 20 Mm < r < 40 Mm Color Index: Blue : 0 – 500 G Green : 500-1000 G Red : 1000+ G Black : average velocity ● Line style: solid lines: ● positive magnetic region ●dotted lines: negative magnetic region Discussion -There is a clear relationship between fast, outward moving radial flow and negative magnetic regions. There is also a clear relationship between the slower, inward moving radial flows and the positive magnetic field regions. --The figure above and the histogram to the left show that in the moat region of sunspots, we see significant outward flows with or without a penumbra for the negative polarity regions. --To the right is a diagram for forces from st 3-D data from our 1 model. It clearly shows that the forces in negative regions act more passively, with a much smaller contribution Conclusion from the Lorentz force (red). Green lines are 1)Azimuthally-averaged moat flows the sum of the work done by the different are independent of the existence of a forces, blue lines for the acceleration penumbra. force, and gray lines for the pressure-driving -This is shown in the analysis of our force. Dotted lines are inflows, solid lines three different sunspot models; each are outflows. X-axis: edge to center of spot. model shows an average outward moat flow of a few hundred meters/second. Each case also These Relationships shows a fast outflow (about 2 km/s) in the (-) polarity region. 2)The fast flows in the (-) polarity regions are primarily granulation flows. The (-) regions are preferentially found on the granule side facing away from the sunspot. Even with no Evershed flow in the penumbra, we still see this Black: se1 Blue: set 2 granulation effect. Red: set3 3)The forces acting in the (-) polarity region act more passively than the forces acting in the (+) polarity region. This explains the asymmetry in the velocities for these different regions.


