Cassini Mission’s UVIS Instrument The Cassini-Huygens
advertisement
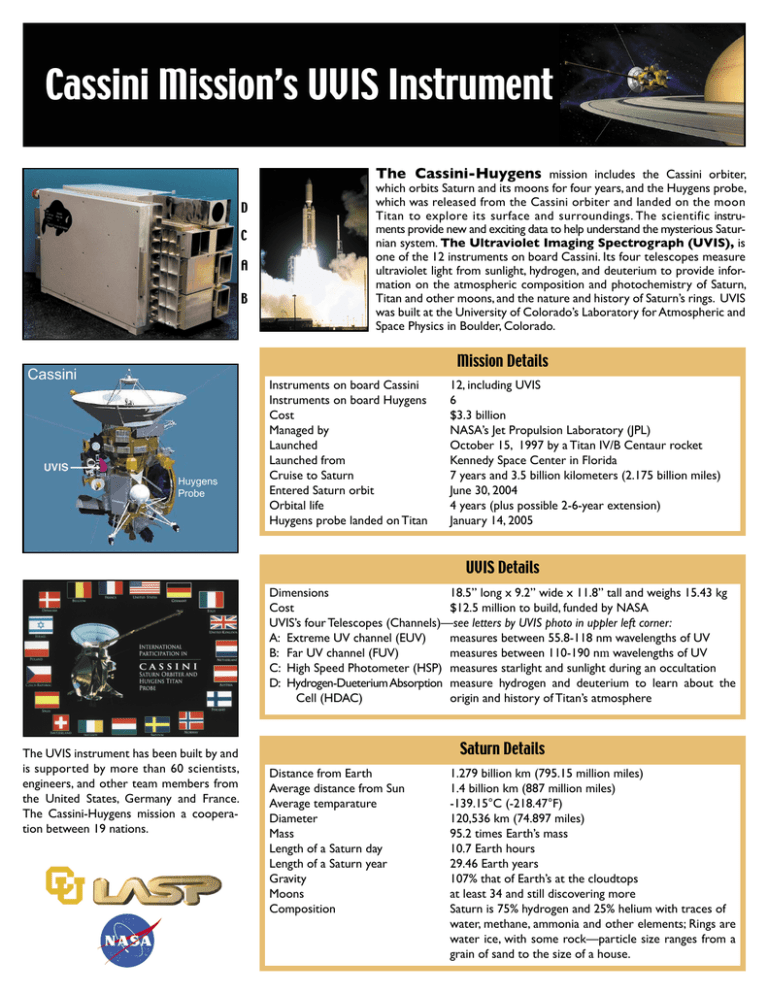
Cassini Mission’s UVIS Instrument D C A B The Cassini-Huygens mission includes the Cassini orbiter, which orbits Saturn and its moons for four years, and the Huygens probe, which was released from the Cassini orbiter and landed on the moon Titan to explore its surface and surroundings. The scientific instruments provide new and exciting data to help understand the mysterious Saturnian system. The Ultraviolet Imaging Spectrograph (UVIS), is one of the 12 instruments on board Cassini. Its four telescopes measure ultraviolet light from sunlight, hydrogen, and deuterium to provide information on the atmospheric composition and photochemistry of Saturn, Titan and other moons, and the nature and history of Saturn’s rings. UVIS was built at the University of Colorado’s Laboratory for Atmospheric and Space Physics in Boulder, Colorado. Mission Details Cassini Huygens Probe Instruments on board Cassini Instruments on board Huygens Cost Managed by Launched Launched from Cruise to Saturn Entered Saturn orbit Orbital life Huygens probe landed on Titan 12, including UVIS 6 $3.3 billion NASA’s Jet Propulsion Laboratory (JPL) October 15, 1997 by a Titan IV/B Centaur rocket Kennedy Space Center in Florida 7 years and 3.5 billion kilometers (2.175 billion miles) June 30, 2004 4 years (plus possible 2-6-year extension) January 14, 2005 UVIS Details Dimensions 18.5” long x 9.2” wide x 11.8” tall and weighs 15.43 kg Cost $12.5 million to build, funded by NASA UVIS’s four Telescopes (Channels)—see letters by UVIS photo in uppler left corner: A: Extreme UV channel (EUV) measures between 55.8-118 nm wavelengths of UV B: Far UV channel (FUV) measures between 110-190 nm wavelengths of UV C: High Speed Photometer (HSP) measures starlight and sunlight during an occultation D: Hydrogen-Dueterium Absorption measure hydrogen and deuterium to learn about the Cell (HDAC) origin and history of Titan’s atmosphere The UVIS instrument has been built by and is supported by more than 60 scientists, engineers, and other team members from the United States, Germany and France. The Cassini-Huygens mission a cooperation between 19 nations. Saturn Details Distance from Earth Average distance from Sun Average temparature Diameter Mass Length of a Saturn day Length of a Saturn year Gravity Moons Composition 1.279 billion km (795.15 million miles) 1.4 billion km (887 million miles) -139.15°C (-218.47°F) 120,536 km (74.897 miles) 95.2 times Earth’s mass 10.7 Earth hours 29.46 Earth years 107% that of Earth’s at the cloudtops at least 34 and still discovering more Saturn is 75% hydrogen and 25% helium with traces of water, methane, ammonia and other elements; Rings are water ice, with some rock—particle size ranges from a grain of sand to the size of a house. UVIS Scientific Observations—Measuring Ultraviolet Light in the Saturn System These are color-enhanced images of the rings from the UVIS observations during the Saturn orbit insertion event—when Cassini entered Saturn’s orbit after a nearly seven year journey—on June 30th (MST).The turquoise represents more water ice in the rings. The red represents the most transparent (optically thinnest) area in the rings. From the inside out, the “Cassini division” in faint red at left is followed by the A ring in its entirety. The A ring begins with a “dirty” interior of red followed by a general pattern of more turquoise further away from the planet, which indicates material with more ice.The red band roughly three-fourths of the way outward in the A ring is the Encke gap. This color-enhanced image of two density waves in Saturn’s A ring was made from the stellar occultation (a star shining through from behind) observed by UVIS when the spacecraft was 6.8 million kilometers (4.2 million miles) from Saturn. Bright areas indicate the denser regions of the rings. The bright bands on the left are the “peaks” of a density wave caused by gravitational stirring of the rings by Saturn’s moon, Janus. A smaller density wave on the right is produced by the moon Pandora. UVIS observed the brightness of the star Xi Ceti as the rings passed in front of it, and the flickering of the starlight was converted into the ring density depicted by the image. Electromagnetic Spectrum Extreme UV: 55.8-118 nm Far UV: 110-190 nm 10-6 nm 10-5 nm 10-4 nm 10-3 nm 10-2 nm 10-1 nm (1 Å) 1 nm 10 nm 100 nm 3 10 nm (1 μm) 100 μm 1000 μm (1 mm) Saturn’s retrograde moon, Phoebe, in visible and ultraviolet (UV) light. On the right side, an ultraviolet image taken at a distance of 31,000 km, shows an irregular surface and bright crater region (white area). The ultraviolet spectra confirm water frost on Phoebe’s surface. The image was taken by UVIS during the spacecraft’s closest approach to Phoebe, on June 11, 2004. The large crater shows clearly in the image on the left. Visible Light Near Infrared Far Infrared Microwave 100 cm (1 m) 10 m 100 m 1000 m (100 km) 10 km 100 km 1 Mm 10 Mm 100 Mm To learn more, visit http://lasp.colorado.edu/cassini Ultraviolet 10 mm (1 cm) 10 cm Saturn and its rings block hydrogen Lyman-alpha emission. This image was taken on July 13, 2004, from a distance of 5 million km.You can see the southern auroral zone, the sunlit crescent Saturn, the dark nightside, the dim rings, Saturn’s shadow on the rings, and Saturn’s extensive atomic hydrogen corona. X-Rays 10 nm 10 μm Oxygen surrounds Saturn in a large donut: fluctuations show active processes in Saturn’s E ring. A movie showing a series of four similar images tracking the changes in the Saturn magneosphere’s atomic oxygen emission during Saturn approach December 2003 - June 2004 can be found at http://lasp. colorado.edu/cassini on the What’s New page. Gamma-Rays Radio
