Document 12610103
advertisement
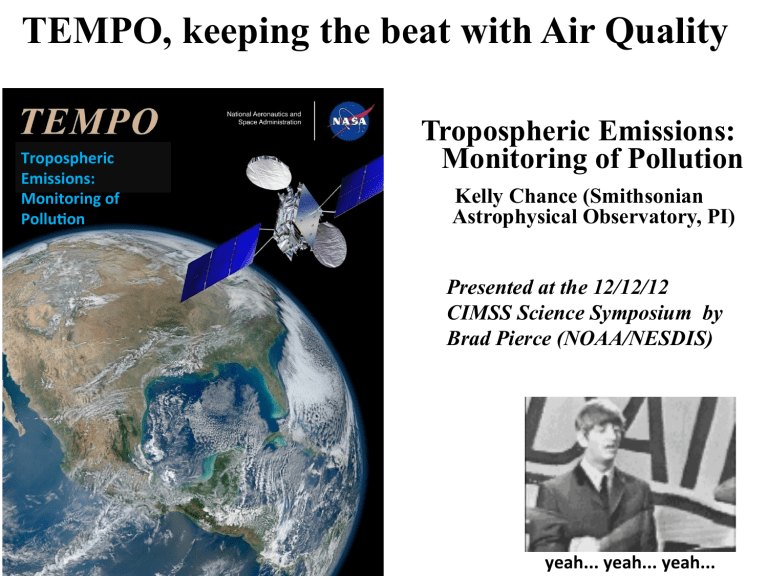
TEMPO, keeping the beat with Air Quality Tropospheric Emissions: Monitoring of Pollu9on Tropospheric Emissions: Monitoring of Pollution Kelly Chance (Smithsonian Astrophysical Observatory, PI) Presented at the 12/12/12 CIMSS Science Symposium by Brad Pierce (NOAA/NESDIS) yeah... yeah... yeah... TEMPO is part of NASA's Earth Venture Instrument program that includes small, targeted science investigations designed to complement NASA's larger research missions. TEMPO is NASA's first Earth Venture Instrument award under the agency's Earth System Science Pathfinder program. Completed in 2017 at a cost of not more than $90 million, TEMPO will share a ride on a commercial satellite as a hosted payload with a target launch in 2019 q TEMPO spectroscopic measurements in the ultraviolet and visible provide a tropospheric measurement suite that includes the key elements of tropospheric air pollution chemistry: ozone (O3), nitrogen dioxide (NO2), sulfur dioxide (SO2), formaldehyde (H2CO), glyoxal (C2H2O2), water vapor (H2O), aerosols, cloud parameters, and UVB radiation. q TEMPO provides much of the atmospheric measurement capability recommended for GEO-CAPE in the 2007 National Research Council Decadal Survey, Earth Science and Applications from Space: National Imperatives for the Next Decade and Beyond. TEMPO will launch at a prime time to be a component of a global GEO constellation for pollution monitoring, with a major focus on intercontinental pollution transport, along with Europe (Sentinel-4) and Asia (Geostationary Environment Monitoring Spectrometer). Sun-synchronous nadir heritage* Instrument Detectors Spectral Coverage [nm] Spectral Resolution [nm] GOME (1995-2011) Linear Arrays 240-790 0.2-0.4 SCIAMACHY (2002-2012) Linear Arrays OMI (2004) 2-D CCD GOME-2a,b (2006, 2012) Linear Arrays OMPS-1 (2011) 2-D CCDs 240-2380 270-500 0.2-1.5 0.42-0.63 Ground Pixel Size [km2] Global Coverage 40×320 (40×80 3 days zoom) 30×30/60/90 30×120/240 6 days (depending on product) 15×30 - 42×162 daily (depending on swath position) 40×40 240-790 250-380 0.24-0.53 0.42-1.0 (40×80 wide swath; 40×10 zoom) near-daily 50×50 250×250 (depending on product) daily *Thanks to the late Dieter Perner of MPI Previous experience (since 1985 at SAO and MPI) Scientific and operational measurements of pollutants O3, NO2, SO2, H2CO, C2H2O2 (& CO, CH4, BrO, OClO, ClO, IO, H2O, O2-O2, Raman, aerosol, ….) 355 times GOME-2 spatial resolution 50 times OMI spatial resolution Each 2 km × 4.5 km pixel is a 2K element spectrum from 290-690 nm! GEO platform selected by NASA for viewing greater North America The image cannot be displayed. Your computer may not have enough memory to open the image, or the image may have been corrupted. Restart your computer, and then open the file again. If the red x still appears, you may have to delete the image and then insert it again. Important! Best fitting to date: 2.0×10⁻⁴ full-scale radiance (Instrument vs. algorithm: Tied! S/N drives instrument if meas. requirements can be met Composite assembled from data acquired by the Suomi NPP satellite in April and October 2012 using Visible Infrared Imaging Radiometer Suite (VIIRS) “day-night band” What’s this? What’s this -> 1999 National Emission Inventory (NEI) Carbon Monoxide (CO) emissions NO2 emissions look similar What’s missing? What’s missing ->Natural Gas flares from oil production at the Bakken shale formation. OMI NO2 trends over the Canadian oil sands McLinden, C. A., et al. (2012), Air quality over the Canadian oil sands: A first assessment using satellite observations, Geophys. Res. Lett., 39, L04804, doi:10.1029/2011GL050273. TEMPO measurements will capture spatial structure in NO2 emissions that are not captured by current LEO observations OMI NO2 trends over the Canadian oil sands McLinden, C. A., et al. (2012), Air quality over the Canadian oil sands: A first assessment using satellite observations, Geophys. Res. Lett., 39, L04804, doi:10.1029/2011GL050273. TEMPO measurements will capture the diurnal cycle of NO2 that is missed by current LEO observations Average summertime (April–September) OMI BEHR NO2 column densities for 2005, (From Russell et al., Atmos. Chem. Phys. Discuss., 12, 15419–15452, 2012) TEMPO UV-Vis observations significantly improve sensitivity to O3 near the surface over the use of UV only Zoogman et al. (2011) used an OSSE framework to demonstrate substantial improvement in comparison with surface ozone concentrations when UV+Vis measurements, such as from TEMPO, are assimilated Surface O3 RMSE TEMPO Science Team: Data product developers, in bold, conduct TEMPO space-based validation with other satellites Team Member Institution Role Responsibility K. Chance SAO PI Overall science development; Level 1b, H2CO, C2H2O2 X. Liu SAO Deputy PI Science development, data processing; O3 profile, tropospheric O3 J. Carr Carr Astronautics Co-I INR Modeling and algorithm M. Chin GSFC Co-I UV aerosol product, AI R. Cohen U.C. Berkeley Co-I NO2 validation, atmospheric chemistry modeling, process studies D. Edwards NCAR Co-I VOC science, synergy with carbon monoxide measurements J. Fishman St. Louis U. Co-I Education/Public outreach D. Flittner LaRC Project Scientist Overall project development; STM; instrument cal./char. J. Herman UMBC Co-I Validation (PANDORA measurements) D. Jacob Harvard Co-I Science requirements, atmospheric modeling, process studies S. Janz GSFC Co-I Instrument calibration and characterization J. Joiner GSFC Co-I Cloud, total O3, TOA shortwave flux research product N. Krotkov GSFC Co-I NO2, SO2, UVB M. Newchurch U. Alabama Huntsville Co-I Validation (O3 sondes, O3 lidar) R.B. Pierce NOAA/NESDIS Co-I AQ modeling, data assimilation R. Spurr RT Solutions, Inc. Co-I Radiative transfer modeling for algorithm development R. Suleiman SAO Co-I, Data Mgr. Managing science data processing, BrO, H2O, and L3 products J. Szykman EPA Co-I AIRNow AQI development, validation (PANDORA measurements) O. Torres GSFC Co-I UV aerosol product, AI J. Wang U. Nebraska Co-I Synergy w/GOES-R ABI, aerosol research products J. Leitch Ball Aerospace Collaborator Aircraft validation, instrument calibration and characterization R. Martin Dalhousie U. Collaborator Atmospheric modeling, air mass factors, AQI development D. Neil LaRC Collaborator GEO-CAPE mission design team member J. Kim Yonsei U. Korean GEMS, CEOS constellation of GEO pollution monitoring J. McConnell York U. Canada Collaborators, Science Advisory Panel B. Veihelmann ESA CSA PHEOS, CEOS constellation of GEO pollution monitoring ESA Sentinel-4, CEOS constellation of GEO pollution monitoring At CIMSS, RAQMS and WRF-CHEM chemical data assimilation activities will utilize TEMPO O3 and NO2 measurements to improve air quality forecasting capabilities Alignment with 2007 Decadal Survey The NRC 2007 Decadal Survey “Earth Science and Applications from Space: National Imperatives for the Next Decade and Beyond” recommended missions including Geostationary Coastal and Air Pollution Events (GEO-CAPE). The atmosphere part of GEO-CAPE is recommended to include the measurements proposed here. TEMPO makes all the requisite GEO-CAPE UV/visible measurements, including O3, NO2, H2CO, and aerosols (plus several additional species including SO2). Together with the proposed IR instrument for CO measurements, all GEO-CAPE atmospheric requirements for North America are fulfilled. TEMPO 2019 US Geostationary IR sensor would complete the integrated global observing system! TEMPO 2019
