CIPS v4.20 Level 3e Ground Station Summary Files I. Introduction
advertisement

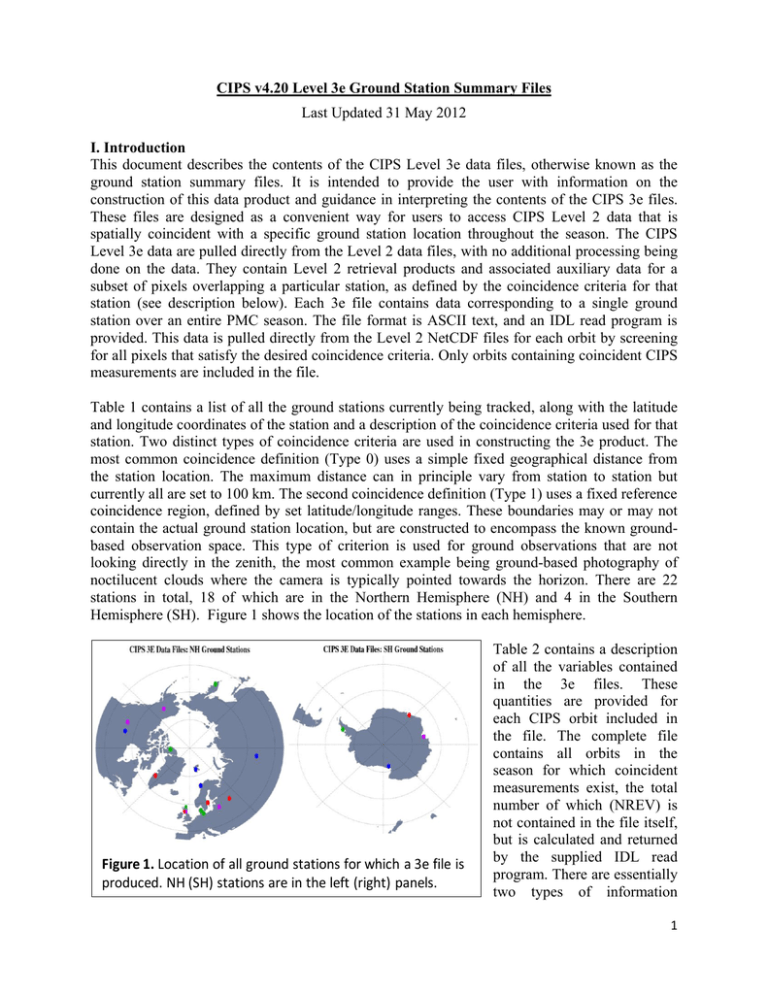
CIPS v4.20 Level 3e Ground Station Summary Files Last Updated 31 May 2012 I. Introduction This document describes the contents of the CIPS Level 3e data files, otherwise known as the ground station summary files. It is intended to provide the user with information on the construction of this data product and guidance in interpreting the contents of the CIPS 3e files. These files are designed as a convenient way for users to access CIPS Level 2 data that is spatially coincident with a specific ground station location throughout the season. The CIPS Level 3e data are pulled directly from the Level 2 data files, with no additional processing being done on the data. They contain Level 2 retrieval products and associated auxiliary data for a subset of pixels overlapping a particular station, as defined by the coincidence criteria for that station (see description below). Each 3e file contains data corresponding to a single ground station over an entire PMC season. The file format is ASCII text, and an IDL read program is provided. This data is pulled directly from the Level 2 NetCDF files for each orbit by screening for all pixels that satisfy the desired coincidence criteria. Only orbits containing coincident CIPS measurements are included in the file. Table 1 contains a list of all the ground stations currently being tracked, along with the latitude and longitude coordinates of the station and a description of the coincidence criteria used for that station. Two distinct types of coincidence criteria are used in constructing the 3e product. The most common coincidence definition (Type 0) uses a simple fixed geographical distance from the station location. The maximum distance can in principle vary from station to station but currently all are set to 100 km. The second coincidence definition (Type 1) uses a fixed reference coincidence region, defined by set latitude/longitude ranges. These boundaries may or may not contain the actual ground station location, but are constructed to encompass the known groundbased observation space. This type of criterion is used for ground observations that are not looking directly in the zenith, the most common example being ground-based photography of noctilucent clouds where the camera is typically pointed towards the horizon. There are 22 stations in total, 18 of which are in the Northern Hemisphere (NH) and 4 in the Southern Hemisphere (SH). Figure 1 shows the location of the stations in each hemisphere. Figure 1. Location of all ground stations for which a 3e file is produced. NH (SH) stations are in the left (right) panels. Table 2 contains a description of all the variables contained in the 3e files. These quantities are provided for each CIPS orbit included in the file. The complete file contains all orbits in the season for which coincident measurements exist, the total number of which (NREV) is not contained in the file itself, but is calculated and returned by the supplied IDL read program. There are essentially two types of information 1 included for each orbit. A single summary line contains definitive information about the orbit, including AIM orbit number, date, time, number of coincident pixels, cloud fraction in the coincidence space, and so forth. Also included in this line are mean cloud parameters (albedo, radius, ice water content and cloud fraction) averaged over all pixels within a 500-km radius of the station. This is meant to give the user additional information about the morphology of the cloud field in the larger general vicinity of the station. (Note that we do not calculate mean cloud parameters for the coincident pixels themselves, but leave that to the user, who may want to apply their own data screening to this averaging process – see hints below). Following this summary line are multiple lines containing detailed information about each coincident pixel, including geolocation information and the CIPS Level 2 cloud parameter retrievals. A default value of 0.0 for the cloud parameters is used to indicate that no cloud is present. Each file contains an extensive header that includes the station name, location, coincidence criteria used and a complete description of the data variables in the file (essentially reproducing the information in Table 2). II. CIPS data quality and known issues Users are strongly encouraged to read the Level 2 data product documentation for a description of the Level 2 products and guidance in their interpretation. One data quality issue that affects the version 4.20 data involves cloud pixels where a particle radius less than 20 nm is retrieved. As discussed in the Level 2 documentation, there are strong physical arguments why CIPS should not be sensitive to particles this small, and therefore these retrievals are thought to be erroneous, probably due to errors in the background Rayleigh subtraction. Because the retrieved particle radius and ice water content (IWC) are considered unreliable for these pixels, they are screened in the Level 3e summary file. The CLD_MAP value (see Table 2) remains at 1 for these pixels, indicating credible cloud detection, however the radius and IWC values are set to a default -999. Note that this is consistent with the data screening employed in the CIPS Level 3c latitude-binned summary files. Another topic discussed in detail in the Level 2 documentation is the CIPS Quality Flag parameter (QF). Pixels with QF=2 are on the edge of the CIPS orbit swath and have the fewest number of independent measurements per pixel (scattering angles in the measured cloud phase function). These pixels are considered unreliable for radius and IWC retrieval, and hence these parameters are also set to the default -999 value for these pixels. The user is urged to use caution with the albedo values for these pixels, and may want to screen them in calculating mean albedo or cloud fraction from the coincident pixels. III. Sample results In this section we show sample results of CIPS coincident data for two ground stations in the NH 2010 season. These two stations were chosen because they represent the two different types of coincidence criteria described above. Figure 2 illustrates CIPS coincidences with the Alomar station (Station #1) for a single orbit on July 8 2010. The small, solid black circle indicates the ground station location. The grey shaded area represents all CIPS Level 2 pixels for this orbit (within the limited range of this plot – obviously the orbit swath extends much farther both north and south of this range). The green area represents the CIPS pixels within the 100-km coincidence criterion for this station, whereas the blue pixels indicate the larger 500-km radius used to calculate the average cloud parameters surrounding the coincident measurements (see Table 2). All CIPS pixels for which clouds were detected are colored red, to give an idea of the 2 cloud morphology on this orbit. The number of coincident pixels (NPIX) for this orbit is 1,263. The cloud fraction detected by CIPS within the coincidence region is 40.2% (and a slightly smaller 36.4% within the 500-km region). The number of coincident pixels in this example is typical for stations using the 100-km coincidence criteria (Type 0) when the coincidence area is fully contained within the CIPS orbit swath. (The resolution of the CIPS Level 2 pixels is 25 km2, so a 100-km radius area should Figure 2. Example of the CIPS sampling for a coincidence contain 1002/251,257 pixels.) This with the Alomar station in 2010. The station location is represented by the black dot. Background grey pixelated particular example is an optimal area shows all CIPS level 2 pixels for this section of the coincidence in that the station is close to orbit, with cloud pixels shown in red. The green (blue) the center of the CIPS orbit swath. areas show pixels within 100 km (500 km) of the station. Therefore most if not all of the coincident pixels are the highest quality CIPS measurements, QF=0, since these occur in the middle of the orbit swath where the camera overlaps are the densest. In situations where the ground station location is closer to the edge of the orbit swath, there can be fewer coincident pixels and a higher fraction of them will be QF=1 or 2, which are the CIPS edge pixels. Figure 3 illustrates the distribution of the NPIX values for this station over the entire 2010 PMC season. Note that all values up to the maximum allowable ~1,250 are represented in the distribution, but by far the most common occurrence (> 60% of all orbits) is when the full coincidence space is sampled. Finally, Figure 4 provides an example of the CIPS sampling characteristics that can occur for ground stations with the Type=1 coincidence criterion. This plot illustrates a coincidence with the MISU station in Stockholm on July 26, 2010. The meaning of the different colored pixels is the same as for Figure 2. Here we can see visually how the defined coincidence area (green) is offset from the actual ground station location. In this case it is shifted to the north and west, as the ground-based camera is pointed north, towards higher latitudes, and west to observed noctilucent clouds at sunset. Another important characteristic of the Type 1 coincidence criterion is that the defined coincidence area is generally much larger than the 100-km radius used for Type 0 stations. Thus they will on average contain far more CIPS pixels, assuming they are largely contained within the orbit swath (NPIX = 11,092 in this case). Note Figure 3. Distribution (occurrence frequency) also that the coincidence area need not be of the NPIX parameter (number of contained entirely within the standard 500-km coincident pixels per orbit) for the Alomar loose criterion radius. In this particular case the station in the 2010 season. CIPS cloud fraction within the coincidence region 3 is 9.7% and within the 500-km radius is only 2.5%. Figure 4. Same as Figure 2, but for a coincidence with the MISU station (Stockholm) on July 26, 2010. In this case, instead of the coincidence region (green) being defined as within 100 km of the station, it is defined by a set latitude/longitude range according to the ground station camera field of view. 4 Table 1. CIPS Level 3e ground station list. Coincidence Max Type Distance Latitude Longitude (type=0) Latitude Range (type=1) Longitude Range (type=1) [60,65] [8,20] # Name 1 Alomar 69.278 16.009 0 100 2 IAP 54.117 11.772 0 100 3 SvalSat 78.230 15.395 0 100 4 Sondrestrom 66.997 -50.615 0 100 5 Poker Flat 65.117 -147.461 0 100 6 Eureka 80.00 -86.25 0 100 7 Davis -68.574 77.976 0 100 8 Rothera -67.568 -68.123 0 100 9 McMurdo -77.847 166.671 0 100 10 Syowa -69.000 39.583 0 100 11 Andoya 69.294 16.020 0 100 12 MISU 59.365 18.058 1 13 Royal Observatory 55.920 -3.190 0 100 14 Thurso 58.600 -3.530 0 100 15 La Ronge 55.1 -105.3 0 100 16 Port Glasgow 55.93 -4.68 1 [56,61] [-15,-2] 17 Athabasca 54.73 -113.32 1 [56,61] [-124,-111] 18 Kamchatka 53.07 158.62 1 [56,61] [148,161] 19 Novosibirsk 54.87 83.10 1 [56,61] [73,85] 5 20 Moscow 56.00 37.48 1 [56,61] [27,40] 21 Vilnius 55.00 26.00 1 [56,61] [16,28] 22 Aarhus 56.17 10.20 1 [56,61] [0,12] 6 Table 2. Definition of variables in CIPS Level 3e Ground Station summary file (per orbit). Variable Name Units Type/Dimension Description REV DATE UT NA NA Hours INTEGER/SCALAR LONG/SCALAR REAL/SCALAR LTIME Hours REAL/SCALAR NPIX CLD_PRESENCE NA NA INTEGER/SCALAR INTEGER/SCALAR NCLD NA INTEGER/SCALAR CLD_FRAC % REAL/SCALAR ALB_LOOSE 10-6 sr-1 REAL/SCALAR RAD_LOOSE nm REAL/SCALAR IWC_LOOSE g/km2 REAL/SCALAR FRAC_LOOSE % REAL/SCALAR LAT LON SZA DIST Degrees Degrees Degrees km REAL(NPIX) REAL(NPIX) REAL(NPIX) REAL(NPIX) QF NA INTEGERNPIX) CLD_MAP NA INTEGER(NPIX) RADIUS nm REAL(NPIX) ALBEDO 10-6 sr-1 REAL(NPIX) IWC g/km2 REAL(NPIX) AIM orbit number Date in YYYYMMDD format Mean UT time of coincident measurements Mean local time of coincident measurements Number of coincident pixels. PMC present anywhere in the coincident pixels. (0 = no, 1 = yes) Number of pixels where ice is detected. Fraction of coincident pixels containing ice. [0.,1.] Median albedo within 500 km of station (cloud pixels only) Median particle radius within 500 km of station (cloud pixels only) Median ice water content within 500 km of station (cloud pixels only) Cloud fraction within 500 km of station. Latitude of each pixel. [-90,90] Longitude of each pixel. [0,360] Solar zenith angle of each pixel. Distance of each pixel from ground station location. Level 2 QUALITY_FLAG value for each pixel. Indicatory of data quality (see Level 2 documentation). Identifies cloud pixels (1 = cloud, 0 = no cloud) Retrieved particle mode radius in each pixel (if cld_map = 1) Retrieved cloud albedo in each pixel (if cld_map = 1) Retrieved cloud ice water content in each pixel (if cld_map = 1) ___________________________________________________________________________ Created by Jerry Lumpe 30 May 2012 7


