Quadratic Functions
advertisement
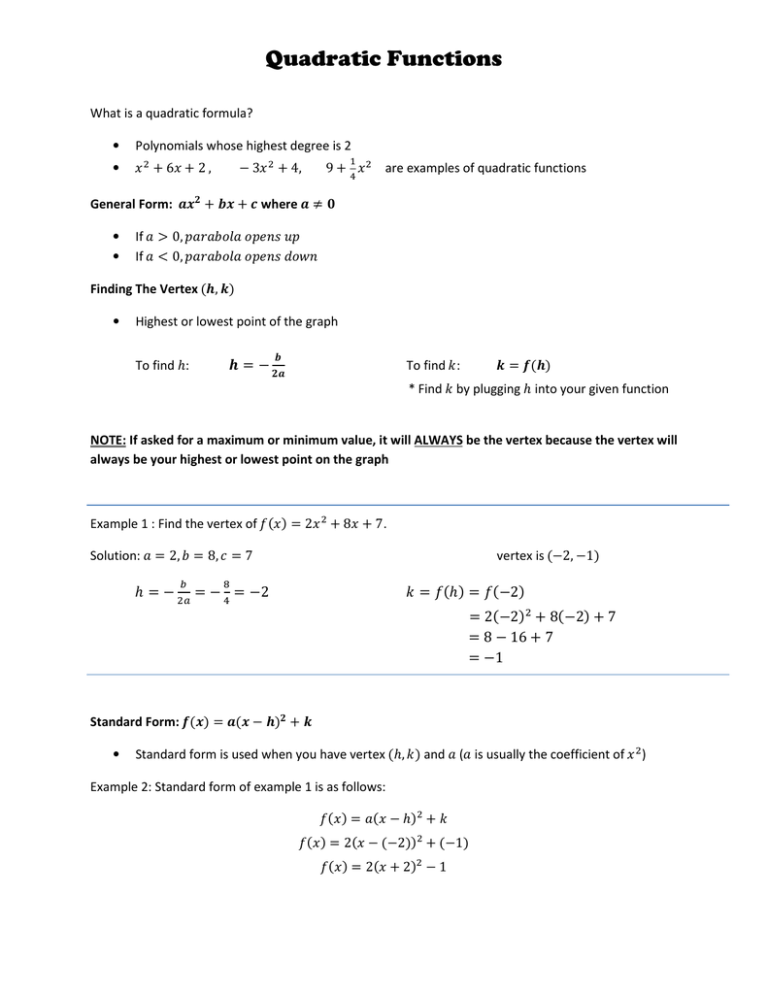
Quadratic Functions What is a quadratic formula? • Polynomials whose highest degree is 2 • + 6 + 2, − 3 + 4,9 + are examples of quadratic functions General Form: + + where ≠ • • If > 0, If < 0, "# Finding The Vertex (%, &) • Highest or lowest point of the graph To find ℎ: % = − To find *: & = +(%) * Find * by plugging ℎ into your given function NOTE: If asked for a maximum or minimum value, it will ALWAYS be the vertex because the vertex will always be your highest or lowest point on the graph Example 1 : Find the vertex of ,() = 2 + 8 + 7. Solution: = 2, = 8, / = 7 ℎ=− 1 2 vertex is (−2, −1) 3 = − = −2 * = ,(ℎ) = ,(−2) = 2(−2) + 8(−2) + 7 = 8 − 16 + 7 = −1 Standard Form: +() = ( − %) + & • Standard form is used when you have vertex (ℎ, *) and ( is usually the coefficient of ) Example 2: Standard form of example 1 is as follows: ,() = ( − ℎ) + * ,() = 2( − (−2)) + (−1) ,() = 2( + 2) − 1 Graphing Polynomials Leading Coefficient Test Given the function ,() = 7 7 + ⋯ + + 9 Follow these steps to graph polynomials: 1. Use Leading Coefficient Test to determine the behavior of the ends of the graph. 2. Find the real zeros (in other words, find x-intercepts which means set 4 = 0). 3. Use factored form of function to determine multiplicity of each term (exponent of each term). a. If multiplicity is odd, graph crosses the x-axis at ) ( is each of the real zeros). b. If multiplicity is even, graph touches the x-axis at ) . 4. Determine turning points of graph (= highest degree of function turning points =5 − 6) 5. Graph real zeros on the graph, then pick a test point in between each graphed point to determine the behavior throughout the graph Congratulations, you have successfully graphed a polynomial!!! Way to go!
