The sections in your report
advertisement

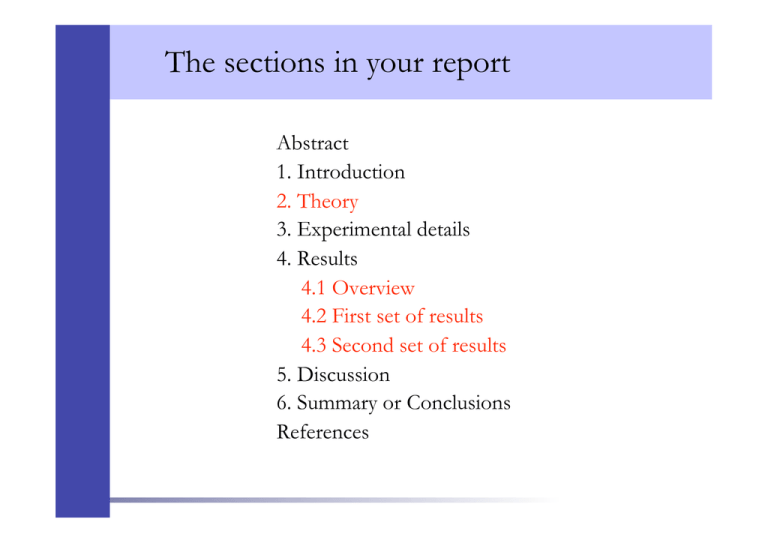
The sections in your report Abstract 1. Introduction 2. Theory 3. Experimental details 4. Results 4.1 Overview 4.2 First set of results 4.3 Second set of results 5. Discussion 6. Summary or Conclusions References 2nd Year Laboratory Experimental Report • All scientific reports should be arranged in sections • It is helpful to number sections and divide each section into subsections with meaningful subheadings where required. • Grammar and spelling are very important. – Redrafting extremely important for readability – Start with rough notes – Redraft several times – reading afresh each time Grammar and Spelling • Write in the third person and the passive tense, i.e. "the voltage was measured at ten second intervals" rather than "I/we measured the voltage...". • “I / we” is fine by me Grammar and Spelling • Write in the third person and the passive tense, i.e. "the voltage was measured at ten second intervals" rather than "I/we measured the voltage...". • Use the present tense for statements which are still true rather than actions pursued in the past, i.e. "the work function was calculated from the Fowler-Nordheim equation to be 4.0 eV which is in agreement with the published value". • Theoretical statements are also written in the present tense, e.g. "The condition for maxima in the intensity is given by the equation...". • Spell check your report. • Carefully proof read your work; get someone else to read it to be sure that it makes sense. – Proof read yourself – read what is there, not what you think is there – Is it understandable to someone who doesn’t know the expt? – Do you trip up on any sentences? Abstract • Less than 200 words and generally shorter, e.g. 50-100 words. • It should be possible to read the abstract in isolation. • Important numerical results which are not artefacts of the particular experiment can be quoted. • Where there are many numerical results only general trends or conclusions should be stated. • Concise summary of: 1) what you did and why; 2) what you found (including main numerical results); 3) what it means – Write this last 1. Introduction • The basic physics being investigated. • A brief account of the principles behind the experimental methods adopted and an indication of the scope and significance of the work. • An introduction to the rest of your report. • Start with general background and context; focus down on relevant details; finish by stating your aims – understandable to someone who has not done the expt? – don’t include experimental details or results 3. Experimental Details • This section should include details of the apparatus and methods used - draw diagrams! • Do not describe how standard equipment works. • Special pieces of equipment merit more space. • Describe any non-standard methods which you used; comment on experimental procedures. • Do not give a "recipe" for the reader. • Use past tense to describe what you did • Report what you did and why; and any problems encountered 4. Experimental Results • You may remind the reader of what it is you are trying to measure and show how this is to be accomplished. • You should always give a concise description of how your results were deduced from your raw data. • You may also choose to include a preliminary discussion of your data. E.g. do your results agree with previously published results or theory? (I would prefer you save this for the discussion) • Use full paragraphs to describe and explain your results • Comment on the quality of any fits and whether your error bars have been over or underestimated You must show your results! • The raw data, or processed data, should be presented in the clearest possible way - tables or graphs – but not both. – Don’t include unnecessary tables – Don’t use tables for just a few numbers that could be included in text – Always quote errors on measured quantities • Graphs should be drawn using a data plotting package. • The derivation of results from graphs must be shown clearly. • Scales should be carefully chosen to most clearly indicate any features in the data. • Carefully explain how your errors were estimated. Error bars/ crosses should be shown on some if not all of the points. Displayed material • Figures should be given self contained figure captions. • Figures and tables should be numbered consecutively i.e. Figure 1, Figure 2a, Figure 2b, Figure 3, etc.; Table 1, Table 2 – Always refer to figures by these figure numbers – Graphs are figures • All diagrams, photographs, etc. are also Figures. • Carefully consider how to combine data sets in each figure to clearly display your data. Poor Quality Graphs Figure 1. M versus x Graphs Figure 1. Magnetisation versus Mn composition, x, for a series of Y(Al1-xMnx) intermetallic samples. The data (■) were collected at a temperature of 5 K in an applied field, H, of 50 A/m using a SQUID magnetometer. The red line is a least squares fit to the data using the model of Jones et al. [1] and confirms the linear increase in the magnetisation with Mn concentration x. 5. Discussion • Start with a concise summary of your main results and a comparison with previous / expected values • Discuss the significance of your results when compared with the published results or accepted theories. – Are your results consistent with expected values or not? – I don’t like “reasonable agreement” • Discuss the sources of error, the problems encountered in your own investigation and their effect on the end result. – When listing possible sources of error, assess which are likely to be important and which not, quantitatively if possible – construct arguments and give evidence • Consider the advantages and disadvantages of the experimental method you have used. • You could include a section summarising the contents of your report, reiterating the points you feel are important and giving the conclusions of your experimental investigation.


