The Seasonality of Con ict ∗ Jenny Guardado and Steven Pennings
advertisement
The Seasonality of Conict∗
Jenny Guardado
†
and Steven Pennings
‡
Preliminary Draft, Comments Welcome
February 1, 2016
Abstract
We exploit the seasonality of agricultural labor markets to estimate the eect of changes in
the opportunity cost of armed conict. Based on a dynamic model, we argue that exogenous,
anticipated, and transitory changes in labor demand due to harvesting are able to capture the
intra-temporal substitution between labor and conict because they hold constant the marginal
utility of consumption and the present value of future victory. Indeed, regressions on modelgenerated data show that the estimated eect of seasonal labor shocks on violence are closer to
the true opportunity cost eect than those exploiting persistent shocks to labor demand (e.g.
commodity prices, rainfall shocks with lasting consequences) which will tend to be upward
biased. Empirically, we exploit exogenous sub-national variation in the timing of harvest due
to local climatic conditions to examine its eect on the intensity of violent conict. Using
data from two dierent conict settings Iraq and Pakistan our results show that the onset
of harvesting usually leads to a statistically signicant reduction in the number of monthly
insurgent attacks.
∗ We are grateful for comments from Scott Ashworth, Eli Berman, Ethan Bueno de Mesquita, Anthony Fowler
and participants of the Third Formal & Comparative Conference (Becker-Friedman Institute), World Bank Seminar
Series, and the Harris School of Public Policy Political Economy Lunch. We also thank nancial support from Ethan
Bueno de Mesquita and the Oce of Naval Research.
† Assistant Professor. Georgetown University. jennyguardado@gmail.com. Project developed while visiting the
Harris School of Public Policy University of Chicago.
‡ Research Economist. World Bank Research Department spennings@worldbank.org. The views expressed here
are the authors', and do not necessarily reect those of the World Bank, its Executive Directors, or the countries
they represent.
1
1
Introduction
During the American Civil War (1861-1865) desertions from the Confederate Army sky-rocketed in
the months of June and July, the harvesting times for tobacco an important Southern crop at the
time (Giure 1997). Similarly, during the Russian Civil War (1917-1922) desertion rates in the Red
and White armies largely formed by peasants were notoriously high during the summer harvest
(Figes 1996 cited by Dal bo and Dal bo 2011: 657). More recently, anecdotal accounts of on-going
insurgencies in Iraq, the Philippines, and Afghanistan have noted that a high share of insurgents
often participate on a seasonal or part-time basis.
1
Such anecdotes suggest that the opportunity cost of ghting the foregone returns from working
are a key consideration among individuals choosing between ghting or working.
Indeed, a
number of scholars draw a theoretical (Becker 1968; Grossman 1991; Dal Bo and Dal Bo 2011)
and empirical connection (Miguel et.
al.
2004; Dube and Vargas 2013; Guardado 2015; Hodler
and Raschky 2014, among others) between the returns to working and the intensity of conict thus
implying that better wages or job prospects reduces the relative attractiveness of ghting. Despite
these ndings, questions remain as to whether economic considerations are an important motivation
for conict (Berman et. al. 2011a); whether the empirical relationship between price shocks and
conict is consistent with opportunity costs (Fearon and Laitin 2003); or whether the exogenous
shocks examined (e.g. rainfall) are a good instrument for income (Sarsons 2011), among others. In
this paper we make a theoretical and empirical case for why economic opportunity considerations
play a role in on-going conict settings.
Theoretically, we examine how seasonal changes in labor demand (motivated by the timing of
harvest) inuences the time allocated to working versus ghting. Because seasonal changes in labor
demand are anticipated, it holds constant important determinants of conict such as the value of
winning (Fearon 2008, Chassang and Padro-i-Miquel 2009), the marginal utility of consumption, the
value of sharing information for counterinsurgency eorts (Berman et. al. 2011a), among others.
As a result, we show that the true opportunity cost of conict can be uncovered almost exactly by
a regression of time allocated to violence on seasonal variation in wages. Yet, because these factors,
(marginal utility of consumption or the value of wining, etc.) are commonly omitted in standard
regressions using highly persistent shocks (e.g.
commodity prices or rainfall shocks with lasting
2 it results in estimates of the opportunity cost eect which are biased upwards (too
consequences)
small). That is, extant estimates showing a negative relationship between commodity price shocks
1 For
Iraq, GlobalSecurity.org estimates that around 40,000 insurgents are full-time or core, while approximately
200,000 participate on a part-time basis (http://www.globalsecurity.org/military/ops/iraq_insurgency.htm). In the
case of the Phillipines, Ferrer and Cabangdang (2012: 263) both from the Philippine army highlight how many
local residents in Mindanao also act as part-time ghters for the Islamic insurgency. In Afghanistan, a number of
reintegration initiatives are targeted to foot-soldiers or seasonal participants who might be participating in exchange
for money (http://newstrategicsecurityinitiative.org/).
2 We
thank Scott Ashworth for this observation.
2
and conict (Dube and Vargas 2013; Guardado 2015) are likely to be a lower bound of the true
eect of these income shocks on conict. Finally, because we model the most common motivations
for conict in the literature either driven by monetary expectations upon victory (greed) or
driven by intrinsic motivations (grievance) we believe it has a wide applicability across dierent
contexts and conict episodes.
Empirically, we estimate the eect of seasonal labor demand in two dierent contexts: the Iraqi
civil conict (2004-2011) and the Pakistani sectarian conict (1988-2010). We focus on changes in
labor demand induced by the timing of harvest of the main agricultural crop in both cases: wheat.
Given the labor-intensive nature of agricultural activities, and the fact that these crops are harvested
annually, they are likely to induce a large, transitory and anticipated change in local demand for
labor.
Since seasonality or the timing of harvest is determined by local climatic conditions and
crop types it is unlikely to be inuenced by on-going conict dynamics thus alleviating potential
endogeneity concerns.
While ideally we would like to instrument local wages with the timing of
harvest, the time-series for local wages are often unavailable in a number of conict (and non-conict
settings) therefore we focus on the reduced form relationship between the number of attacks in a
location and the size of the area harvested.
3 (Iraq, Pakistan) show that at
Our empirical results from these two dierent conict settings
times of greater labor demand (harvest), violent attacks are usually lower compared to regions in
the same country that are not in harvest.
Our main estimates suggest that in a cell or district
with the average crop intensity, the onset of harvest reduces the number of attacks from 4-5% in
Pakistan (BFRS dataset) to 30%-40% in Iraq (WITS dataset) relative to the average for that cell or
district. However, results do also vary depending on data source: in particular estimated eects are
smaller and less precisely estimated using the University of Maryland's Global Terrorism Dataset
(GTD), suggesting the way attacks are coded might be important.
Additional results focusing
on the type of attack (as opposed to overall levels) show that the reduction in violence is mostly
uniform across all types. Finally, using household surveys and monthly weather information for Iraq
we are able to rule out alternative explanations based on temperature, precipitation, state-driven
violence, religious calendars, seasonal migration or job switching.
Instead, consistent with our
interpretation that harvest aects local labor markets and conict, we nd that during harvesting
months agricultural workers tend to have dierentially higher employment rates than other rural
workers.
Relation to the literature.
The empirical ndings suggest that labor market constraints
are an important consideration in a number of dierent armed conicts and contexts.
To the
extent that armed groups rely on part-timers to plan and execute attacks, and these individuals
exhibit a higher demand of their time during harvesting, we expect this constraint to bind and
3 On-going
data-collection for Colombia and the Philippines will further assess the scope of these indings.
3
aect the production of violence. While our nding contrasts with studies highlighting the role
of grievances as a mobile for insurgent participation (Wood 2003), it leaves ample room for other
mechanisms to play a role within the same conict-year.
Second, our paper is able to rationalize the results of recent studies which nd little evidence
for opportunity cost mechanisms:
shocks analyzed.
these may actually be driven by the high persistence of the
For instance, Berman et.
al.
(2011b) document that in some conict regions,
higher unemployment appears to correlate with less violence. The authors argue that this might
be explained by reductions in the cost of buying counter-insurgency information at times of high
unemployment but in our context the marginal utility of consumption is kept constant across
seasons, and so is the incentive to provide information.
Similarly, Blattman and Bazzi (2014)
nd a negative but weak relationship between commodity prices and conict intensity, yet, given
commodity prices are highly persistent, these estimates may actually constitute a lower bound of
the true opportunity cost eect.
Our results call for a deeper investigation into which types of
shocks better allow us to identify the presence of opportunity cost mechanisms.
Third, the paper provides a novel source of exogenous variation in the demand for labor and
cautions against the indiscriminate use of certain persistent income shocks (e.g. commodity prices
or severe damage due to rainfall or lack thereof ) as an instrument. While these shocks are indeed
exogenous to conict dynamics, they can also have distorting eects on an individual's consumption
pattern or on the perceived returns to victory (Fearon 2008; Chassang and Padro-i-Miquel 2009)
thus biasing the estimated eect. Similarly, because our resullts are not based on instrumenting
income with rainfall, it reduces the concern that we are capturing the direct eect of rainfall on
violence. For instance, during rainy seasons it is hard to coordinate and execute armed attacks.
Finally, care should be taken into interpreting our results for the opportunity cost mechanism
as evidence in favor of employment programs or permanent forms of development aid. While there
may be other reasons why these policies should be in place, their persistence across periods may
lead to unintended consequences.
For example, a permanent wage or employment subsidy may
mean that households are wealthy enough to devote time to ght causes they care about. Or, they
may encourage people to capture the rents from these schemes. Indeed, recent studies highlight how
common it is for insurgent groups to appropriate aid which in turn leads to greater armed conict
(Nunn and Qian 2014; Crost et. al. 2014).
4 Similarly, permanent changes in productivity due to
development aid (e.g. improving grain production) may also have a small eect in reducing violence,
as rst mentioned in Fearon (2008). For example, a permanent wage or employment subsidy may
mean that households are wealthy enough to devote time to ght causes they care about. Or, they
may encourage people to capture the rents from these schemes.
4 Other
For instance, a once-o capital
recent examples of aid-theft cited by Nunn and Qian (2014) are Afghanistan, Ethiopia, Sierra Leone,
among others.
4
transfer may go a long way to improve economic livelihoods potentially reducing certain types of
violence (Blattman and Ralston 2015).
2
Theoretical Framework
A large empirical literature typically uses changes in commodity prices as an instrument for income
to assess its eect on conict. We study an alternative driver of the opportunity cost of ghting: the
variation in labor demand due to the timing of harvest. In this section we compare our estimates
of the opportunity cost of conict to those in the literature to examine whether any one measure is
better at uncovering the true eect.
Specically, we compare estimates of opportunity cost parameters from persistent shocks versus
seasonal shocks to labor supply in two simple models of conict. The two models are inspired by
the main motivations for violence in the literature: (i) rebellion for a cause (grievance) or (ii)
rebellion for money (greed).
In Section 2.2 we also provide a sketch of a model assessing the
value of providing information about insurgents, which has a similar mechanism to the grievance
model. For each model, we provide a precise denition of the true opportunity cost of violence mainly, the elasticity of time spent on conict activities with respect to wages keeping everything
else constant and compare it to estimates from a regression of violence on wages using modelgenerated data driven by persistent (e.g. commodity prices) versus seasonal variation in wages. In
both cases we nd that a regression of violence on seasonal variation on wages is able to uncover
the true relationship almost exactly, and is much more accurate than regressions using variation
in wages driven by persistent shocks which will tend to be upward biased.
The reason why estimates using variation in wages driven by persistent shocks are biased is that
everything else is not constant. In fact, persistent shocks which cause a change in wages also lead
to a change in the (i) level of consumption (wealth eects) and (ii) the reward for ghting. For
instance, in the grievance model, the wealthier agent nds that additional consumption adds less
to his utility, and so he reallocates time to violence instead. In the information-based model, the
wealthier household is also less willing to provide information to counterinsurgency forces. In the
greed model, the greater the potential spoils of victory, the greater the time allocated to violence
(Fearon 2008; Chassang and Padro-i-Miquel 2009).
Both of these eects are exacerbated with
the persistence of the shock. Unfortunately, commonly used commodity prices in the literature are
5 Because seasonal
highly persistent: the quarterly persistence of oil and coee prices is around 0.96.
5 Specically,
this is a regression
Arabica Coee (ρ
= 0.95)
lpriceRt = ρlpriceRt−1 +Ξt over 1960Q1-2015Q2 for average oil prices (ρ = 0.97),
= 0.97) taken from World Bank Pink Sheet., with nominal prices
and Robusta Coee (ρ
deated by the US CPI (data from FRED). Results do vary over sub-samples, but commodity prices are still highly
ρ = 0.9 − 0.94 for these same shocks. Rainfall shocks are unsurprisingly not
ρ = 0.04 for Iraq rain cells 11 km x 11 km, 2000-2010, quarterly.
+ γt + µi + θqrt , yet, for most regions in the world it may have little eect on
persistent. For example over 1988-2005,
very persistent at the quarterly level. In contrast,
rain(mm)i,t = ρrain(mm)i,t−1
5
changes in wages are both temporary and anticipated, there is little change in either consumption
or the spoils of victory, which means that our estimates are closer to the true opportunity cost of
violence.
2.1
Model 1: Rebellion for a Cause (Grievance model)
In this model, we assume that rebels engage in violence for some cause in which they place intrinsic value: examples include ethnic or religious hatred, retaliation for past grievances, or nationalism
(Horowitz 1985). That is, rebel violence is in the utility function. To make the mechanism completely clear, we assume that there are no monetary benets from violence, and to keep the model
tractable we do not model the government's response.
A key assumption is that households get
diminishing marginal utility from allocating additional time to violence
UV > 0; UV V < 0,
which
6
means that an increase in opportunity cost will lead to a reduction in time allocated to violence.
Concavity also allows us to assume
limV →0 UV = ∞, which corroborates the prevalence of low-level
insurgencies described in Fearon (2008) - even if the cause is not so convincing. We rst consider
a static model, and then a dynamic model which introduces seasonality and persistent shocks.
2.1.1 Static Model
Consider the problem of a household who has an endowment of one unit of time, and has choose
how much time he wants to spend ghting
exogenous wage
W
V,
and how much time (1
−V)
he wants to work at an
. More formally:
maxV,C U (C, V ) such that
(1)
C = W (1 − V )
(2)
Assuming an interior solution, the household's rst order condition is:
UV = UC W
(3)
Equation 3 says that the marginal utility from spending an extra hour ghting (LHS), must be
equal to the hourly wage weighted multiplied by the contribution of consumption to utility (RHS).
An increase in wages by itself means
UV
must increase, which implies lower violence as
(the substitution eect or opportunity cost channel).
reduce
UC
UV V < 0
However, an increase in wages will also
(the marginal value of extra income in terms of utility,
UCC < 0),
such that
UV
falls
agricultural output.
6 We
also assume that violence and consumption are separable, that is
UCV = UV C = 0.
means that the marginal utility of ghting does not depend on how rich one is.
6
This last assumption
and violence increases (the income eect). Which eect dominates depends on the parameters of
the model. In order to get further, we need to assume a functional form; so we choose a standard
constant relative risk aversion formulation (σ, γ
U (C, V ) =
> 0):
1
ψ
C 1−σ +
V 1−γ
1−σ
1−γ
(4)
The FOC now becomes
ψV −γ = C −σ W
(5)
Taking log of Equation6, the true model of violence is.
1
σ
1
lnV = − lnψ + lnC − lnW
γ
γ
γ
Denition.
(6)
The eect of the opportunity cost of violence is the elasticity of violence with respect
to wages, keeping everything else constant, or
−γ −1 .
∂lnV
1
=−
∂lnW
γ
The problem with estimating empirical analogues of Equation 6 is that consumption is usually
not observed (or is poorly measured) so researchers might be forced to estimate some variety of
lnV = β0 +β1 lnW +et , where et =
σ
γ lnC . However, typically
cov(lnC, lnW ) = σCW > 0 (as people
consume their higher incomes). As such, the estimated eect of the opportunity cost of violence
7 Another way to see this bias is presented in the Appendix.
will be upward biased as in Equation7.
E β̂1 = −
1
1 σ σW C
+
>−
2
γ
γ σW
γ
(7)
The bias outlined above is driven by the fact that increases in wages also increase consumption.
As seasonal variation in wages are anticipated, in a dynamic model consumption these will be
constant, allowing a regression of violence on wages to uncover the true opportunity cost parameter
−1/γ .
In contrast, changes in commodity prices (which are unanticipated and persistent) move
consumption in the same direction as wages, leading to the biases discussed above.
7 Here
we are assuming that we draw
regression of
lnV
on
lnW
from some distribution, solve the model to yield
lnW .
7
lnV
and then run a
2.1.2 Dynamic model: Set-up
In the dynamic model, we assume that the household can accumulate assets
A>0
or debt
A<0
8 While frictionless nancial markets are a simplication, there
at the risk free interest rate 1 + r .
is plenty of evidence in developed (Hsieh et al 2003) and developing (Paxson 1992) countries that
9 The problem of the household is:
people save a large share of anticipated temporary income.
Et
max{Ct+i ,Vt+i ,At+i }∞
i=0
∞
X
βi
i=0
1
ψ
C 1−σ +
V 1−γ
1 − σ t+i
1 − γ t+i
such that
At+i = (1 + r)At−1+i + Wt+i (1 − Vt+i ) − Ct+i
(8)
Log linearizing the rst order conditions and budget constraint yields an intertemporal Euler Equation 9, the same intra-temporal violence-labor FOC as before (Equation 10), and the
log-linearized inter-temporal budget constraint Equation 11. As before,
viation from steady state, except for assets
ât ,
x̂
indicate percentage de-
which are expressed as percentage of steady state
10
consumption.
ĉt ≈ Et ĉt+1
v̂ =
(9)
1
σ
ĉ − ŵ
γ
γ
ât = (1 + r)ât−1 + ŵt −
(10)
W̄ V̄
v̂t − ct
C̄
Now, let's assume that there are two processes driving wages:
(11)
rst this could be driven by
persistent commodity price shocks as in the literature (Equation 12), or it could follow an anticipated
seasonal pattern of high and low wages, as in the empirical part of this paper (Equation 13). For
simplicity, we assume that wages are at the steady state level in the low (non harvest) season
(lnWL
= lnW̄ ),
and they increase by a factor of
χ>0
in the high (harvest) season.
ŵt = ρŵt−1 + êt
(12)
or
8 We
also assume that household discount factor
β=
1
1+r
so that the household doesn't want borrow or save in
steady state.
9 Given
the harvest is only once or twice or year, if agricultural household did not save a substantial fraction of
their income during this period, they would starve to death during the o season.
10 This
allows assets to be zero in steady state.
linearizating, the Euler Equation 9 is
h In simulation
i we typically assume
−σ
Ct−σ = Et Ct+1
(1 + r)β (recall β = (1 + r)−1 ),
are 8 and 5.
8
that
at−1 = 0.
Before log-
and the other two equations
Persistent Shocks.
When
ŵL
=
0
wˆH
= χ > 0 f or t, t + 2, t + 4, ...
lnW
follows a persistent AR(1) process such as when wages are
driven by commodity price shocks (and
of the size of the shock at
t = 0
f or t + 1, t + 3, ...
ât−1 = ŵt−1 = 0)
(13)
consumption jumps on revelation
but then stays constant along the adjustment path.
Constant
consumption is due to the Euler Equation 9, with the size of the movement in consumption being
as in Equation 14.
ĉ0 =
1−β
γ C̄ + W̄ V̄
ŵ0
1 − ρβ γ C̄ + σ W̄ V̄
(14)
In period zero (immediately following the shock), the level of violence is given by Equation 15.
One can see that when
σ=0
(linear utility, no wealth eects), the second term disappears (as in
the static model), and a simple regression yields the true coecient. Yet, in a dynamic setting,
the size of this term also depends on the persistence of the shock. With
v̂0 =
− γ1 β ŵ0 for a transitory shock (ρ
parameter because
β ≈ 1.
However, as
= 0),
ρ → 1,
σ =1
(log preferences)
which is very close to the true opportunity cost
violence will be constant, as in the static model.
σ
1
γ C̄ + W̄ V̄
1
1−β
v̂0 = − ŵ0 − ĉ0 = −
1−σ
ŵ0
γ
γ
γ
1 − ρβ γ C̄ + σ W̄ V̄
Seasonal Shocks.
11
(15)
Unlike persistent unanticipated shocks, seasonal variation in labor demand
due to harvests is anticipated. This means that changes in labor demand do not aect consumption,
which is set based on the present value of income according to the permanent income hypothesis.
For a
χ%
increase in wages during harvest, the solution of the model when wages are seasonal is in
Equation 16.
12 One can see that a regression of log violence on the dierence in violence between
harvest and non-harvest periods is able to uncover the true opportunity cost parameter
11 Note
that along the adjustment path following a persistent shock,
∆v̂t = −(1/η)∆ŵt
−γ −1 .
as consumption is constant.
However, this is not of any practical value since the model is constantly being hit by new shocks and it is hard to
identify the response to a new shock or an old shock.
12 Here
consumption is
c=
W̄ V̄ + η C̄
χ
σ W̄ V̄ + η C̄ (1 + β)
9
lnVH − lnVL
=
(lnVH − lnV̄ ) − (lnVL − lnV̄ )
=
v̂H − v̂L
σ
1
σ
1
c − (wˆL + χ) −
c − wˆL
γ
γ
γ
γ
1
− χ
γ
=
=
(16)
Numerical Simulations
To illustrate the advantage of using seasonality in labor demand, we calibrate the dynamic
model and generate simulated data for both persistent shocks and seasonal labor demand, and
γ = − 13
estimate the regression of log violence on log wages. We calibrate
13
elasticity of violence with respect to wages found in Colombia (-1.5).
indirect inference approach and choose
shock persistence
γ
to match the estimated
Specically, we use an
so that our estimated coecient on simulated data with
ρ = 0.96 (similar to the quarterly persistence of coee prices) matches -1.5, which
is what we empirically nd with the available data. Examples of simulated data and the parameters
14 and Table 4 in the Appendix.15 The other important parameter in the
are shown in Figure 1
model is
σ=2
, which is a common value in macroeconomic models.
With a true opportunity cost of -3 (red line of Figure 1), the estimated coecient from a
regression of violence on seasonal variation in wages is identical to the true opportunity cost
−3
(green line).
−γ −1 =
16 In contrast, when the persistence of wage shocks is high, the estimated elasticity
of violence with respect to wage shocks is biased upwards (i.e.
less negative).
Specically, the
estimated coecient from the regression (in blue) and the analytical expression in Equation 15
17 both increasingly depart from the true opportunity cost as the
from the rst quarter (black)
shock comes more persistent.
For
ρ = 0.96
(as in the data for commodity prices), the bias is
substantial; in fact the estimated elasticity with persistent shocks (-1.5) is around half of the true
13 Yearly
log wages are instrumented by coee prices x coee suitability. Estimated at the municipal level with
xed eects. We drop zero violence municipalities. Data are from Dube and Vargas (2013), though this is our own
regression, not the ones that the authors estimate (the authors use wages as a
14 The
a sequence of shocks
{ê}
are drawn from a normal distribution with SD=0.01 (i.e. the path of
seasonal violence, the data are generated as the impulse response to a
where the size of the shock
χ = 0.05.
will be unaected by changes in
ŵ
is stochastic). For
single seasonality shock, where ŵt = ŵt−2 +êt ,
Simulations conducted using Dynare.
15 β = 0.99 implies a risk free rate of 4%, and ψ doesn't aect the model
16 Persistence (ρ) on the x-axis refers to the AR(1) shock, so naturally the
17 We
dependent variable).
simulations are implemented using the log linearized model Equations 9-13. For the persistent shocks model,
all that much.
estimated coecient on seasonal violence
ρ.
would not expect the regression coecient to be identical to that in Equation 15, as it only reects the
response in the rst quarter after a shock. If the new shock is much smaller than old shocks, then the relationship
between wages and violence will be dominated by adjustment to old shocks, rather than new shocks.
10
Elasticity of Violence to 1% increase in Wage
1
True Opportunity Cost (−1/γ)=−3
Analytical AR(1) model (first quarter)
Regression Coeff. (AR(1) Simulations)
Regression Coeff. (Seasonal) [= True Opp Cost]
Persistence Commodity Prices in Data (Vertical Line)
0.5
0
−0.5
−1
−1.5
−2
−2.5
−3
−3.5
0
0.2
0.4
0.6
0.8
Persistence of Wage Shock (Quarterly)
1
Figure 1: Rebel for a Cause Model: A. estimated coecient (LHS)
elasticity of -3 (which implies
γ = −1/3).
Therefore, the gain from estimating the opportunity
cost parameter from seasonality in wages is the gap between the blue and green lines. Relative to
temporary shocks, the gain is small. But as commodity price shocks are highly persistent, the gain
is sizable in most practical applications.
2.2
Extension: the value of information
Berman et al (2011a) argue that information is a key component of any counterinsurgency strategy:
if government forces do not receive information on where the rebels are hiding (for example),
then counterinsurgency eorts will be ineective. In other words military eort and information
are complements.
In order to gain information, government forces often pay locals for tip-os.
Berman et al (2011b) argue that this provides a reason why they nd a negative relation between
unemployment and violence: when unemployment is high it is cheaper for government forces to
buy information from the local population, which then reduces violence. The fact that the local
population does not provide information freely suggests that there is some sort of utility cost to
providing it (e.g.
they don't like snitching, or it is dangerous).
Hence, the willingness of the
household to provide information depends on its marginal utility of consumption, which could fall
with positive persistent shocks, but is kept constant by seasonal shocks.
We briey sketch the
argument below, given the similarity to the mechanism in the violence for a cause model.
Consider a modication of the static set up in Equation 1 above to incorporate information
11
provided to counter-insurgency forces
UI < 0,
I.
The household doesn't like to provide information, so
and hates each additional unit of snitching even more, such that
UII < 0
(we continue
to assume that utility is separable in information, consumption and time allocated to violence).
The household gets a payment
s
for each snitch, which we assume is constant. The household's
problem is then:
maxV,C U (C, V, I) such that
(17)
C = W (1 − V ) + sI
(18)
The FOC wrt to time allocated to violence is unchanged from Equation 3 above, whereas the
FOC wrt I implies:
−UI = UC s
(19)
One can see that if there is an increase in consumption from a persistent shock (such as a
persistent commodity price shock), then
also must fall.
Note that
−UI > 0
and
UC
will fall (because UCC
−UII > 0,
< 0).
so the only way for
As
s
−UI
is constant
−UI
to fall is for the
household to provide less information: richer households have less need to become an informant
as in Berman et al's (2011b), which could actually increase violence. But because seasonal shocks
are temporary and anticipated they will not lead to a change in consumption, and so
UC
will be
constant, and information provision will be unaected. As before, this allows seasonal variation in
wages to produce an unbiased estimate of the eect of the opportunity cost of violence.
2.3
Model 2: Rebellion for Money (Greed model)
The most popular motivation for conict in the literature is a contest for resources (Haavelmo
1954; Hirshleifer 1988, 1989; Garnkel 1990; Skarpedas 1992; Garnkel and Skaperdas 2007). In
this section, we present the one side of a contest model, where rebels are ghting for control of
economic prots and the probability that they win is increasing in their eort devoted to ghting.
For tractability we keep constant the strength of counterinsurgency forces. In our model, eort is
the time that seasonal ghters devote to conict, which they could otherwise devote to working at
wage
W.
The seasonal ghter balances the extra income they could get working against the greater
chance they will win if they spend that time ghting.
If economic prots are constant, then an
increase in wages makes working relatively more attractive and ghting less attractive. However,
as pointed out by Fearon (2008) and Chassang and Padro-i-Miquel (2009), the same shocks (e.g.
productivity shocks or commodity price shocks) can increase both the costs (foregone wages) and
benets (prots) of ghting, and so have no net eect on violence. In a dynamic setting, the costs of
12
ghting are incurred today, whereas the benets of winning are potentially in the future, such that
negative temporary shocks increase violence more than persistent shocks (Chassang and Padro-iMiquel 2009). Seasonal labor demand allows for a clean identication of the true opportunity cost
of violence, because seasonal variation in wages are temporary and predictable, meaning that the
potential spoils of winning are constant in high versus low labor demand seasons.
Related literature
Our model relates to Fearon (2008), Chassang and Padro-i-Miquel (2009)
and Dal bo and Dal bo (2011).
In Fearon's (2008) baseline model, there are no dynamics, and
the rebels choose the optimal size of their forces, given the marginal cost of recruitment and the
government's response function. Conict is unavoidable and a larger force increases the probability
18 Chassang and Padro-i-Miquel
of winning, which then allows the winner to tax at a given rate.
(2009) present a bargaining model where two players decide to
{attack, not attack}
rather than
choosing the intensity of conict, conditional on a xed labor cost of ghting, and an oensive
advantage. If the rebels win, they gain the resources of the other side and in the dynamic version,
winning is decisive forever.
Dal bo and Dal bo (2011) presents a two-industry, two-factor static
trade model with an appropriation sector to show how sector-specic prices aect conict.
Our
model includes ingredients from all of these models. Like in Fearon (2008), conict varies at the
intensive rather than extensive margin. Like Chassang and Padro-i-Miquel (2009), the gains from
winning are dynamic whereas the costs are static, meaning that temporary but not permanent
productivity shocks aect violence (winning is also decisive). Like Dal bo and Dal bo (2011), our
appropriation/ghting technology is strictly concave in labor (reecting congestion eects); our
production function is non-linear in labor such that real wages depend on the allocation of labor;
and we abstract from the government's response to violence.
2.3.1 Static Model
As in the previous model, the household has one unit of time and decides at the start of the period
how to split it between working or ghting. If the rebels win the ght, the agent earns the economic
prots from production,
Π.
These prots can be thought of as the returns to a xed factor like
land, capital or a natural resource. If the rebels lose, the part-time ghter gains nothing. Whether
the rebels win or lose, the agent still collects labor income from working
(1 − V )W .
that the rebel win is increasing but concave in the time allocated to violence
p = ψV 1−γ
18 In
The probability
V:
(20)
later models, Fearon (2008) add a detection probability, dierent abilities of rebels and governments to tax,
and changes the contest function to a capture functon.
13
0<γ <1
γ)V −γ
governs the eectiveness ghting technology, which means that the
is decreasing in
V .19
p0 (v) = ψ(1 −
A nice feature of this function is that the rst hour of time devoted
to conict is innitely productive (i.e.
limv→0 p0 (v) = ∞),
which captures the stylized fact that
many countries have a low-level insurgency with very little chance of overthrowing the government
(Fearon 2008).
The household's problem is:
maxV pU (cwin ) + (1 − p)U (closes )
such that
cwin = W (1 − V ) + Π
close = W (1 − V )
Output is produced using only labor (1
− V ),
and labor is paid its marginal product
labor markets are competitive, the household takes the wages and prots as given.
W.
As
A is total factor
productivity, which is the key exogenous variable in the model. If household produced a cash crop
for export, and consumed only imported goods, then
A = pY /pC
could capture the terms of trade
used when output, wages and prots (Equations 21-23) are written in terms of the consumption
good.
Y = A(1 − V )α
(21)
W = αA(1 − V )α−1
(22)
Π = Y − W (1 − V ) = (1 − α)A(1 − V )α
(23)
To separate the mechanism from the one above, we make three assumptions:
◦
U (C) = C
(linear utility, risk neutral agents)
◦ No Saving or Borrowing
◦ Violence is NOT in the utility function.
Substituting for
19 The
p
and
U (C),
the HH's problem becomes:
strength of the counterinsurgency is governed by
ψ.
concave.
14
Restricting
0<γ<1
also keeps the objective function
maxV W (1 − V ) + ψV 1−γ Π
| {z }
P rob W in
The FOC is:
1
Π γ
V = ψ(1 − γ)
W
(24)
Taking logs, we can get an equation to take to actual (or simulated) data.
lnV =
1
1
1
lnψ(1 − γ) + lnΠ − lnW
γ
γ
γ
(25)
The true opportunity cost unchanged from Denition 1 in Equation 25 is
requires controlling for
lnΠ
1
∂lnV
= − , but this
∂lnW
γ
in the regression. If instead researchers ran a univariate specication,
lnΠ would be subsumed into the error term.
As
lnW
and
lnΠ are positively correlated (see below),
this will bias upwards the coecient on wages.
Now, suppose that changes in wages are driven by changes in productivity
the terms of trade). By substituting in
see that
A
increases
Π
and
W
lnW
and
lnΠ,
rather than
−γ −1 .
lnV
(or alternatively,
Equation 24 becomes Equation 26. One can
proportionately, and so in Equation 26
constant. This mean that if one ran a regression of
A
on
A
cancels and violence is
lnW , one would get a coecient of zero,
This is Fearon's (2008) result that economic development increases both the
opportunity cost of violence as well as the spoils of war, leaving the level of violence unchanged.
1
(1 − α)(1 − V )α γ
V = ψ(1 − γ)
α(1 − V )α−1
(26)
2.3.2 Dynamic Model
Seasonal variation in productivity provides a context where the opportunity cost of violence changes,
but the prize of ghting is approximately constant. This eectively removes the omitted variable
bias described above, allowing an unbiased estimation of the true opportunity cost parameter
−γ −1 .
The opportunity cost of ghting varies with seasonal changes in productivity because it is
incurred contemporaneously. In contrast, in a dynamic setting the bulk of the prize of winning are
future rents from resources captured, which will be almost constant across seasons because changes
in productivity are temporary and anticipated. In contrast, persistent shocks like commodity prices
raise both the prize and cost of ghting, leading to upwards biased estimates of the opportunity
cost of ghting.
More formally, let
VL (A)
be the value (discounted lifetime expected utility) of a part time rebel
15
ghter not in power deciding how much time to devote to ghting versus working. The state of the
A,
economy is
total factor productivity and whether the rebels are in power (L for lose summarizes
their past defeats). If the rebels win, they will gain prots today
next period
0
VW .
Π and
This value depends on next period's productivity
A
0
the value of being in power
(next period is denoted with
). Like Chassang and Padro-i-Miquel (2009), we make the simplifying assumption that if rebels
win they stay in power forever.
20 If the rebels lose, tomorrow the part-time rebel faces the same
problem, and so have the same value
is
p = ψV
1−γ
.
β
VL (A0 ).
The probability of winning, as in the static model,
is the quarterly discount rate. The household has linear utility in consumption,
cannot save, and does not intrinsically value violence.
W (1−V ) is the income received from working
(regardless of whether the rebels win or lose).
VL (A) = maxV W (1 − V ) + ψV 1−γ (Π + βE [VW (A0 )]) + (1 − ψV 1−γ )βE [VL (A0 )]
| {z }
| {z }
P rob W in
P rob Lose
If the rebels win, then there is no gain from ghting anymore, and so seasonal ghters spend all
their time working (V
prots
Π = (1 − α)Y .
0<λ≤1
such that
= 0).
As before, they earn labor income
W (1 − V ) = αY
and also control
We allow for rebel controlled production to be less productive by a factor
Y = λA(1 − V )α = λA.
As such, the value of a part-time ghter when they
are in power is:
VW (A) = λA + βEVW (A0 )
The exogenous process for productivity is given by Equation 27 if there are persistent productivity or commodity price shocks, or Equation 28 when there is seasonal variation in productivity.
For
persistent shocks:
lnA0 = ρlnA + e
Or, for
(27)
seasonal shocks:
lnAL
= lnĀ
f or t + 1 t + 3, ...
lnAH
= lnĀ + χ f or t, t + 2, t + 4, ...
(28)
The rst order condition is:
20 An
alternative version includes an exogenous loss of rebel control with probability
1 − δ.
For low values of
1 − δ,
the model produced similar results (for high values it sometimes did not solve). But this makes the model much
more complicated.
16
W = (1 − γ)ψV −γ [Π + β [EVW (A0 ) − EVL (A0 )]]
(29)
On the left hand side is the gain from devoting an extra hour to working: wages. On the right
hand side is the gain from an extra unit of violence:
0
p (V ) = (1 − γ)ψV
1−γ
times the prize of winning: prots today
in future utility from being in power
Model solution and simulation
state (where
the change in the probability of winning
A0 = A = Ā),
VW (A0 )
Π,
and the discounted dierence
relative to not being in power
VL (A0 ).
Log-linearizing the model around the non-stochastic steady
the losing value function, FOC, and winning value function become
Equations 30, 31 and 32 respectively. If one could run a regression of violence
controlling for the prize of winning
(ΠΠ̂ + β(V̄W Ev̂W t+1 − V̄L Ev̂Lt+1 )),
would estimate the true opportunity cost parameter
v̂
on wages (ŵ ) and
Equation 31 suggests one
−γ −1 .21
V̄L v̂L,t = ŵt W̄ (1 − V̄ ) − v̂ W̄ V̄ + (1 − γ)v̂ψV 1−γ Π̄ + β V¯W + ψV 1−γ Π̄πˆt + β V¯W Ev̂W,t+1 + β V¯L Ev̂L,t+1
(30)
1
1 ΠΠ̂ + β(V̄W v̂W t+1 − V̄L v̂Lt+1 )
v̂ = − ŵt +
γ
γ
Π + β(V̄W − V̄L )
(31)
Ā
v̂W,t = ¯ ât + βv̂W,t+1
VW
(32)
V
v̂
1−V
(33)
Wages and prots become:
ŵ = â + (1 − α)
π̂ = â − α
V
v̂
1−V
(34)
The model is not analytically tractable, so instead we simulate data when productivity is driven
by persistent shocks (like commodity price shocks) or anticipated seasonal variation in productivity,
and estimate a regression of simulated violence on simulated wages. As in the previous model, we
calibrate the parameters so that the estimated opportunity cost parameter when wages are driven
by persistent shocks (with
ρ = 0.96)
is -1.5, as estimated in the data for Colombia (parameters in
22 As before, with a persistent shock of
the appendix).
21 Unfortunately,
ρ = 0.96,
the bias due to omitting variation
the prize of winning is typically unobserved, and when productivity shocks are persistent the
prize of winning is co-linear with wages.
22 Other
parameters are
λ, ψ
from PWT8 (full value 0.5459).
and
λ
α. α = 0.5 calibrated to the all-countries, all-years average of the labor share
ψ are chosen to keep the steady state share of violence low (at around 7%),
and
17
Persistent shocks (ρ=0.96); "Greed" Model−Generated Data
0.2
0.1
0
−0.1
Elasticity of Violence to 1% increase in Wage
1
True Opportunity Cost (−1/γ)=−3
Regression Coeff. (AR(1) Simulations)
Regression Coeff. (Seasonal) [= True Opp Cost]
Persistence Commodity Prices in Data (Vertical Line)
0.5
0
−0.2
5
10
15
20
25
30
35
40
Seasonal Labor Demand; "Greed" Model Generated Data
0.2
−0.5
−1
0.1
−1.5
0
−2
−2.5
Violence (deviation from SS)
Wages (deviation from SS)
(1/γ)Prize from fighting (deviation from SS)
−0.1
−3
−0.2
−3.5
0
0.2
0.4
0.6
0.8
Persistence of Wage Shock (Quarterly)
5
10
15
20
25
30
35
40
1
Figure 2: Rebel for Money Model: A. estimated coecient (LHS) and B. simulated data (RHS)
in prize of winning is substantial: the estimated coecient of -1.5 is around half of the true value
of
−3 = −γ −1
(Figure 2 LHS, blue line).
The bias is small for very transient shocks, but rises
sharply as shocks become persistent. In fact, as shocks become perfectly persistent, the estimated
elasticity of violence with respect to wages becomes positive. In contrast, a regression of violence
on seasonal variation in wages almost exactly uncovers the true opportunity cost parameter (-2.98
(green line) versus a true value of -3 (red line)). Examples of simulated paths of violence, wages
and the price of ghting are shown on the RHS of Figure 2: in the persistent shocks simulation
(top panel), the prize of ghting rises slowly in the middle of the simulation and then falls.
23 In
the bottom panel, the prize of winning is almost completely unaected by seasonal movements in
productivity, which is what allows us to uncover the true opportunity cost parameter with a simple
regression of violence on wages.
while matching the elasticity of violence to wages in the data with
23 The
ρ = 0.96.
prize of the ghting moves slowly because it is forward looking: in steady state prots today are only around
2% over the value of winning (Π̄/(Π̄
+ β(V̄W − V̄L )).
18
3
Data and Empirical Methodology
The results described above lead to the following empirical implication: the onset of harvest has
a negative impact on conict intensity by increasing the returns to working (e.g. wages) relative
to ghting.
To bring this implication to the data ideally one would instrument the variation in
monthly wages driven by harvest and examine its eect on conict.
In practice, conict-ridden
areas (and even non-conict ones) often lack comprehensive time-series for local wages, hence we
estimate the reduced-form eect of violence on harvest onset. The idea is that a negative coecient
would be consistent with the idea that increases in local labor demand reduces the attractiveness
of ghting. Additional evidence showing that harvest brings about changes in local labor markets
also supports the idea that the eect is driven through this mechanism.
3.1
Data
The data for our conict episodes relies on a number of dierent sources. For every conict episode
we sought the most disaggregated data on violent incidents to match the ne-grained spatial variation of harvesting calendars across the country. Because we exploit monthly by-cell or by-district
changes in labor markets and include a number xed eects indicators, the only factors that could
confound the eect observed are those which vary at the cell-by-month or district-by-month level
(for example, precipitation or temperature).
Violence.
Our main dependent variable is the number of attacks per cell
the number of attacks per district per month.
24 per month or
For each case we attempt to examine as many
dierent datasets on violence as possible, as a way to avoid assigning disproportionate weight to
a single data collection procedure given the well-known diculties in recording violence. We use
both very precisely geolocated datasets (e.g. latitude, longitude) as well as those in which the level
of aggregation is that of small administrative units (e.g. districts or municipalities). For Iraq we
use the World Incident Tracking System (WITS) and the Global Terrorism Dataset (GTD). We
also examine results using SIGACTS v.3. provided by Berman et. al. (2011a), which is based on
coalition reports but is sensitive to the specication used and discussed further in the Appendix.
In the case of Pakistan, we use the BFRS dataset on political violence which is available at the
district-level as well as the GTD data which is precisely geo-located.
Harvesting Calendars.
The timing of harvest for each cell or district is constructed from the
FAO Global Agro Ecological Zones v3.0
25 (GAEZ v.3.0) which provides high resolution maps for
the start and length of the growing cycle for a number of crops. Our harvesting indicator takes
the value of 1 in the month immediately after a given cell ends its growing cycle. Because this will
24 A
cell is the equivalent of around 121 square kilometers, which is 47 sq miles or 2/3 the area of the District of
Columbia
25 Available
at: http://www.gaez.iiasa.ac.at/
19
measure imprecisely those areas whose cycle ends early in the month, we also conduct robustness
checks which simply examine the month in which growing ends.
For each crop we also capture
whether the crop cultivated uses high, medium or low inputs which captures whether the crop
is mainly for subsistence or commercial agriculture. Because our indicator captures the onset of
harvesting for any type, one given cell could have more than one harvesting month if it cultivates
more than one type of crop and these dier in their harvesting date.
In the case of planting, we follow the same approach and create an indicator for the month
prior to the start of the growing season under the logic that this is the time in which land is
prepared and sowed before seeds can grow.
Robustness checks for planting also include shifting
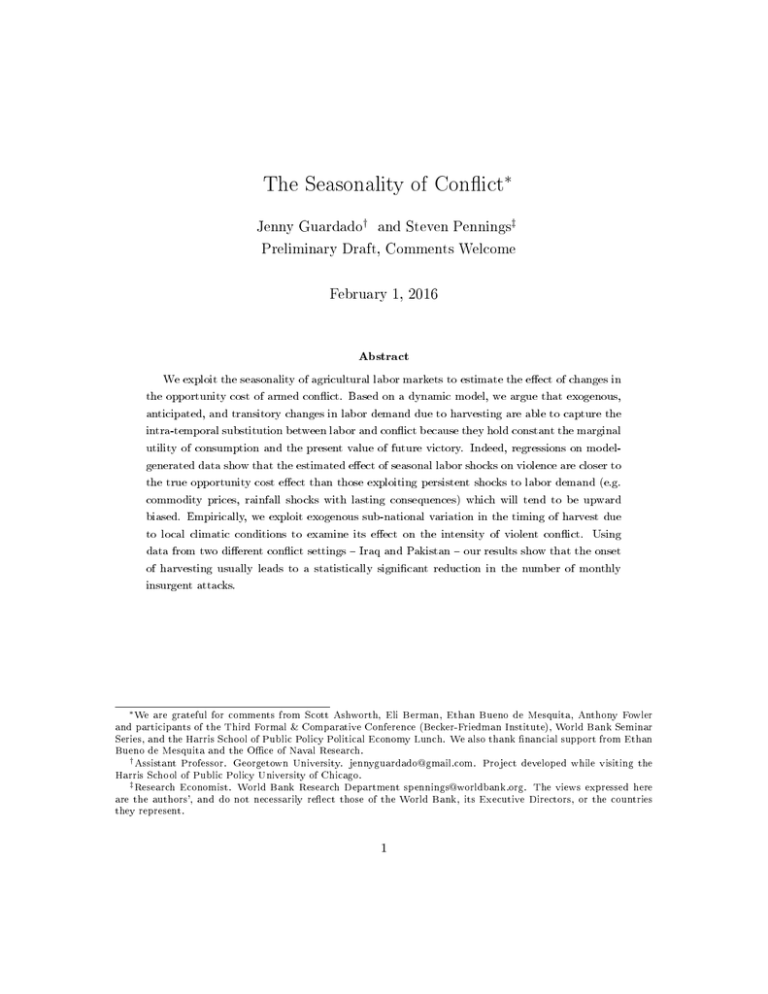
the calendar by one month to examine whether results are robust. As an example, Figure 3 below
shows the harvesting calendars for Iraq.
Since the harvesting date varies across cells within the
year, it provides within country variation in the month in which wheat is cultivated thus allowing
for identication of its eect. For Iraq, around half the wheat is cultivated in June, yet, some areas
also harvest as late as September and others as early as April.
Figure 3: Harvesting Calendar Iraq
Crop Production.
Crop production is measured in hundreds of square kilometers and is calcu-
lated by the FAO using statistics from the year 2000 following the outline of the study Agriculture
Towards 2010/30. We interact the harvesting and planting indicator with the historical intensity
of crop production to avoid giving greater weight to areas with little to no crop production.
To illustrate, Figures 4 through 6 show the raw images provided by GAEZ v.3.0 and those once
linked to a 0.1 by 0.1 decimal degrees grid for the Iraqi case (approximately 11kms by 11kms cells).
20
Figure 4 shows the intensity of wheat production; Figure 5 shows the start day cycle for medium
input crops and Figure 6 shows the length of the cycle. The weighted harvesting calendar is thus
determined by when wheat is planted (start day in days) combined by how long it needs to grow
according to where it is cultivated (length cycle) and weighted by how much wheat is cultivated in
the cell.
Figure 4: Left: Wheat Production. Right: Grided Production
Figure 5: Left: Start Day Medium Input Wheat Irrigated. Right: Gridded Start Day
21
Figure 6: Left: Length of Cycle Medium Input Wheat Irrigated. Right: Gridded Length Cycle
Additional controls.
Additional control variables at the cell or district level include those
of precipitation and temperature. Although the timing of harvesting is unlikely to be inuenced
by crop production, it is possible that monthly factors determining harvest may also aect the
intensity of violence thus confounding our results.
Therefore, we collected data on monthly-cell
or monthly-district measures of precipitation (in milimeters) and temperature (degrees celsius) for
Iraq (2003-2010) and Pakistan (1988 to 2010) coded by Willmott and Matsuura (2001).
To examine the eect of harvesting on local labor markets we also examine household surveys
which ask for monthly patterns of employment and time use, and which are designed to be representative of the rural sector. While the survey asks for monthly employment patterns, unfortunately it
does not do the same for wages. In the case of Iraq, we use the Living Standards and Measurement
Study collected by the World Bank in 2006-2007.
3.2
Let
26
Estimation
c
index each 0.1 by 0.1 decimal degree cell in the country (approximately 11 kms by 11 kms
or 121 square kilometers),
Attackscimt ,
i
index districts,
m
months and year
t
.
Our outcome of interest
is the number and type of attacks in a given cell, district, calendar month and year.
This is equivalent to looking at the monthly number of attacks per 121 square kilometers.
key independent variable
harvest in cell
c,
district
Harvcim × P rodci
i
, month
m
Our
is the number of hundred square kilometer of wheat in
and year
t
. In all specications we also include the eect of
the planting season on violence. At the cell level we estimate:
Attackscimt = αit + γm + β(Harvcim × P rodci ) + xcimt + ecimt
At the district level, we estimate a similar specication (without the c subscripts):
26 Available
at: http://econ.worldbank.org/
22
(35)
Attacksimt = αit + γm + β(Harvim × P rodi ) + ximt + eimt
Where
αit
is a district by year xed eect, and
γm
(36)
is a month xed eect (e.g June);
xcimt
is a
vector of monthly cell or district characteristics such as monthly temperature in degrees Celsius and
precipitation in millimeters. The parameter of interest is
β
which captures the eect of harvesting
on conict intensity and types of attacks.
Standard errors are clustered in two ways. First, we cluster at the governorate-year level which
allows for correlation across districts within the same governorate, while still having a large number
27 Second, we cluster at the district level, which accounts
28 Finally,
for serial correlation in the error terms for that spatial unit (Panel B in those same tables).
of clusters (Panel A of Tables 1, 9 and 3).
for comparability with the BFRS dataset, which is available at the district level, we aggregate cellbased estimates to the district level (Panel C of Tables 1, 9 and 3), with standard errors clustered
at the district level.
3.3
Threats to Identication
Our identication strategy exploits the fact that seasonality or the timing of harvest is clearly
exogenous to the intensity of armed conict.
Specically, we exploit the roll-out of harvest and
29 Since the
compare cells in harvest with other cells in the same district and month that are not.
timing of harvest is given by a combination of geographic and climate factors, it is unlikely to be
30 Certainly conict may aect crop production itself, yet, this
manipulated by conict dynamics.
would only run against nding any relationship between the harvesting month and the intensity of
armed conict within a district.
While reverse causality is not a concern, a more important challenge comes from omitted variable bias or time-varying determinants of harvest (e.g. precipitation, or temperature) which may
correlate with conict. For example, in the Iraqi case Figure 7 below shows how the onset of harvesting (roughly from May to July) is indeed accompanied by an increase in temperature and a
decrease in precipitation. If temperature were to have a positive eect on conict, as a number of
studies suggest (Burke et. al.2009; Hsiang et. al. 2013), this would exert an upward bias in our
results. That is, the true coecients would be actually larger (e.g. more negative) than the our
estimated coecient. Similar concerns arise with the amount of precipitation, since intense rainfall
27 Bertrand
et al (2004) argue that in di-in-di studies, serial correlation does not lead to incorrect inference if
the policy variable (harvest in our case) is not serially correlated.
28 In
order to prevent results that are sensitive to particular observations, in all cell-based regressions we drop
outliers dened as those above the 99th percentile (conditional on a positive number of attacks).
29 Alternatively, how violence changes in districts in harvest relative to the change in districts not in harvest.
30 Moreover, since we are looking at months, these constitute a relative large window. That is, while is it possible
that conict may shift grain collection for some weeks, it is unlikely to do so for a whole month since it would be
pointless from the production standpoint: either crops will not be ripe or would be losing moisture as time passes.
23
may constitute a physical impediment to conducting attacks.
However, as shown in the LHS of
Figure 7, precipitation is actually lower at times in which most of the harvesting is ocurring such
that, if anything, coecients would also be upward biased.
Figure 7: Monthly Precipitation (left) and Temperature (right)Patterns in Iraq
4
Empirical Results
Our results show that across dierent conicts seasonal labor markets play a key role in determining
within-year variation in the intensity of violence. Given the dierences in data sources and coding
methods we present each case separately while holding constant the main specication.
The Iraqi Conict
Between 2004-2011 Iraq was grippled by a civil conict along sectarian lines as well as Sunni
insurgencies in numerous parts of the country. The intensity of the conict, coupled with the long
reliance on agriculture as an economic activity and the cultivation of wheat as the main subsistence
crop, makes it an ideal setting to explore the importance of seasonal labor markets for violence
intensity. Figure 8 and 9 below shows the spatial and time distribution of conict incidents across
cells of approximately 0.1 by 0.1 degrees (or approximately 11 kms by 11 kms) recorded by two
dierent datasets: WITS (left) and GTD (center).
As noticed in the bottom panel, these dier
both in the overall frequency of the attacks recorded and their distribution over time.
24
Figure 8: Left: WITS. Right: GTD.
Figure 9: Left: WITS. Right: GTD.
WITS Dataset (Iraq).
Our analysis starts by examining the patterns of insurgent activity
using geo-coded incidents captured by the Worldwide Incidents Tracking System (WITS) which
is based on media accounts of terrorist events.
31 This dataset focuses on incidents that are both
international and signicant in nature and is used as a reference point for the State Department
32 In addition to tracking the number of terrorist events, the dataset also provides
(Wigle 2010).
31 Available at: http://www.nctc.gov/site/other/wits.html
32 International meant any acts that involved the citizens
or territory of more than one country.
(...)
What
constituted a signicant act was even fuzzier and was legally left to the opinion of the Secretary of State,[5] although
there were some prescribed rules promulgated by the State Department. For example, a signicant attack meant an
act of terrorism that either killed or seriously injured a person, or caused USD $10,000 in property damage. (Wigle
2010)
25
broad categorizations of the type of terrorist attacks whether it was an armed attack, an attack
using improvised explosive device (IED), a suicide bomb, among others.
We use these dierent
categorizations to examine whether harvest induces insurgent groups to switch to certain tactics
at the expense of others (Bueno de Mesquita 2013).
Specically, we distinguish between labor
intensive attacks, or those that require greater manpower to be carried out (e.g. armed attack or
assault), and asymmetric attacks, those in which participants are not able to exchange re and
have generally lower manpower requirements (e.g. IED's) (Bueno de Mesquita et. al. 2015). We
also report results where we pool across all attack types.
Table 1 Panel A & B shows the estimates from Equation 35 using as dependent variable the
monthly number of terrorist incidents across cells (aprox. 121 square kms) between 2004 and 2010.
Columns (1) through (3) in Panel A show how the onset of harvest leads to a reduction in total
levels of violence, and a reduction in both asymmetric and labor-intensive attacks.
In terms of
magnitude, the coecient of -0.94 in column (1) suggests that an increase of one hundred square
kilometers of wheat production at harvest leads to a reduction of approximately 0.94 less total
attacks per month. Considering the average production of wheat at the cell-level is 0.019 hundred
square kilometers (1.9 square kms), the coecient implies a reduction of 0.018 attacks, or around
37% of average number of total attacks per month per cell (0.049). Similar eects are shown in
column (2), where a reduction of 0.5 asymmetric attacks per hundred square kilometers of wheat
cultivated at harvest also represents around a 40% reduction in the average number of asymmetric
attacks, while column (3) shows the reduction in labor intensive attacks by 0.45 per hundred sq km
in harvest, or about 36% of mean labor intensive attacks. Consistent with these ndings, column
(4) shows that the number of victims declines by 1.3 for each additional hundred square kilometers
of cultivated wheat at harvest or 38% evaluated at the mean number of victims per month. These
results are signicant at the 1% level. In Panel B, we cluster standard errors at the district level
(rather than gov× yr) in order to take account of serial correlation. Although this level of clustering
doubles the standard errors, coecient estimates are still signicant at the 5% level. In Panel C, we
aggregate cell-level data up to the district level (also with district level clustering). The estimates
are signicant at the 5% level, and coecients sizes (and % of mean attacks) are only slightly
smaller than those in Panels A and B. Additional results in the appendix show that the results are
mostly driven by the reduction in armed attacks, IEDs and bombings during harvest (Table 5).
Table 6 and 7 show these ndings are similar when restricting the sample to wheat producing areas
33
or areas which experience conict during the sample, respectively.
33 Additional
results in the Table 8 in the appendix shows that harvest seems unrelated to the mix of labor versus
asymmetric attacks once we condition on violence.
26
Table 1: Seasonal Labor and Violent Incidents in Iraq: WITS Data
(1)
(2)
(3)
(4)
Panel A: GovXYear Clusters
VARIABLES
Harvcim × P rodci
Mean DV
Observations
GovXYear Cluster
Total
Asymm
Laborint
Victims
-0.946***
-0.504***
-0.450***
-1.318***
(0.204)
(0.120)
(0.098)
(0.291)
0.049
0.024
0.024
0.066
371,242
371,242
371,242
371,242
119
119
119
119
Panel B: District Clusters
Harvcim × P rodci
Mean DV
Observations
District Cluster
-0.946**
-0.504**
-0.450**
-1.318**
(0.422)
(0.233)
(0.195)
(0.589)
0.049
0.024
0.024
0.066
371,242
371,242
371,242
371,242
101
101
101
101
Panel C: Aggregating by District
Harvcim × P rodci
Mean DV
Observations
District Cluster
-0.739**
-0.369*
-0.380**
-1.018**
(0.355)
(0.204)
(0.174)
(0.489)
2.15
1.080
1.067
2.91
8,484
8,484
8,484
8,484
101
101
101
101
District X Year FE
Y
Y
Y
Y
Month FE
Y
Y
Y
Y
Temp& Precip
Y
Y
Y
Y
Planting
Y
Y
Y
Y
Outliers, dened as above 99th pct, dropped.
P rodci
is measured in hundred sq kilometers.
The average level wheat production for Iraqi cells / district
is 0.019 / 0.86 hundred sq kilometers, respectively
*** p<0.01, ** p<0.05, * p<0.1
GTD Dataset (Iraq).
As a cross-check to our results we run the same specication but now
using as dependent variable instances of violence coded by the Global Terrorism Dataset (GTD).
This dataset is maintained by the National Consortium for the Study of Terrorism and Responses
to Terrorism (START) at the University of Maryland and is also based on media reports, includes
relatively more detailed information on attack types, yet exhibits a much lower frequency of attacks
overall. Table 9 in the Appendix shows that there is some evidence of lower seasonal attacks during
harvest periods, but it is not robust across specications. Specically, in Panel A an increase of
a hundred square kilometers of wheat cultivation per cell at harvest leads to a reduction of 0.09
attacks, driven almost entirely by asymmetric attacks. These results are signicant at 10% level,
and suggest a fall in the number of attacks by about 7-8%. The results in the rest of the table are
not signicant. A more detailed investigation of dierences between the GTD and WITS results
27
are an area for future research.
34
Mechanism and Alternative Explanations
For these results to be consistent with the theoretical framework, it must be that the onset of
harvest in a cell leads to tangible dierences in labor market outcomes.
To assess whether this
is the case we use 2006 LSMS Iraqi household survey, to examine whether regional patterns of
harvesting relate to employment and wage changes among agricultural workers. Ideally, we would
like to match each respondent to a particular cell and follow it throughout the years. However, due
to privacy concerns and budget constraints, the survey only provides a cross-sectional snapshot at
the time of harvest of individual employment at the governorate level in Iraq (of which there are
18), therefore, this evidence should be taken as indicative of seasonal patterns of employment until
more ne-grained information becomes available.
Figure 10 shows the dierence in the probability of employment among agricultural workers
(relative to non-agricultural workers) by month.
As shown, these dierences, controlling for a
number of factors, closely follow the harvesting season in rural Iraq. This is consistent with the
idea that harvesting aects conict by inuencing local labor markets.
Figure 10: Monthly Employment Patterns
Y-axis: coecients from a regression of monthly employment (Do you worked in this job in month...?)
on agricultural worker status. Additional controls include: individual's age, level of education, gender,
household size and language (Arab or not). We include governorate xed eects and cluster the standard
errors at the survey cluster.
34 Further
robustness tests in the appendix show these results are similar when disaggregating among dierent
conict categories 10, while shows that the relative mix of tactics conditioning on violence appears to be
unrelated to the onset of harvest (Table 11).
28
Job Switching and Migration.
One concern with these ndings is whether the wording of
the question leaves open the possibility that individuals switched jobs within the year. However, of
the 11,157 individuals surveyed living in rural areas only 521 individuals or 4.67% reported more
than one occupation throughout the year and 0.23% reported the maximum of three occupations
during the year. Thus unlikely to be switching across occupations throughout the year. A related
concern is whether individuals migrate to other areas for work, potentially explaining the observed
patterns of conict.
However, among agricultural workers, the share of individuals reporting an
absence from home for an extended period is only 3.67%.
Religious Calendar.
In addition to showing how employment patterns vary with monthly
harvesting season, it is important to rule out the presence of any religious signicance or activities
associated with harvest which may explain the decline in violent activities.
Although Islamic
religious festivities are common to all districts, its exact dates changes each year.
However, for
the period under study in Iraq (2004-2009) and Pakistan (1988-2011) Ramadan always fell between
August and October or August and January respectively, well after the harvesting season in each
case.
More importantly, these festivities are likely to be captured in specications that include
month of the year xed eects. Nonetheless, we make sure that harvesting does not carry a local
religious signicance that would explain the reduced violence and examine the 2008 Iraqi Time Use
survey to examine whether the hours allocated to religious activities vary by month.
Figure 12
in the Appendix shows the coecients from a regression of hours spent on religious activities on
whether the individual is an agricultural worker or not. For each month, there is no dierence in
religiosity among agricultural workers versus others. However, we do observe a slight reduction in
religious activities in June, the month when about half of the districts experience harvest. These
patterns are consistent with the idea that the reduction in violence is unlikely to be driven by
increased religiosity among agricultural workers at harvest.
The Pakistani Conict (1988-2010)
For the case of Pakistan we examine patterns of seasonal conict using the BFRS Political Violence
Dataset (Bueno de Mesquita et.
al.
2015) which carefully categorizes every violent incident regardless of whether terrorist in nature or not into whether it is conventional (e.g. labor intensive)
or asymmetric (e.g. relies less on labor) for Pakistan between 1988 and 2010. We also include the
Global Terrorism Dataset (GTD) which provides precisely geolocated information on the number
35
of attacks across the country for the same period.
35 More precisely, the authors distinguish between militant, conventional and asymmetric attacks as follows Militant
attacks are those attributed to organized armed groups that use violence in pursuit of pre-dened political goals in
ways that are:
(a) planned; and (b) use weapons and tactics attributed to sustained conventional or guerrilla
warfare and not to spontaneous violence. Conventional attacks by militants include direct conventional attacks on
military, police, paramilitary, and intelligence targets such that violence has the potential to be exchanged between
the attackers and their targets. Asymmetric attacks include both terrorist attacks by militants, as well as militant
29
BFRS Dataset (Pakistan).
Table 2 below presents the results with the same specication
as before but using district-level attacks in Pakistan between 1988 and 2010. The rst row shows
that the onset of harvest is associated with a reduction in the total number of attacks (column 1)
and the total number of attacks by militants (column 2) which is mostly driven by the reduction in
asymmetric attacks (column 3). In contrast, there is a negative, yet small and imprecise eect on the
number of conventional attacks per district per month throughout the period. This is potentially
driven by the fact that conventional attacks are about 10 times less prevalent than asymmetric
attacks.
Nonetheless, these coecients suggest that an additional hundred square kilometers at
harvest would lead to a reduction of 0.001 monthly district attacks.
Since on average, districts
cultivate about 4.51 hundred square kilometers of wheat and the average number of monthly attacks
per district is 0.12, the coecients imply an overall reduction of 4-5% in the number of attacks
evaluated at means.
Similar eects, if not larger, are observed for the planting season.
Other
results looking at the share of certain types of attacks yield no clear pattern of results (Table 13 in
the appendix); in addition, state-initiated attacks are not more prevalent during harvesting months
(not shown), thus are not driving the reduction in other forms of violence.
Table 2: Seasonal Labor and Violent Incidents in Pakistan: BFRS Data
VARIABLES
Harvcim × P rodci
P lancim × P rodci
Mean DV
Observations
Clusters
(1)
(2)
(3)
(4)
Total
Total Mil
Mil Asym
Mil Convt
-0.001**
-0.001**
-0.001**
-0.000
(0.001)
(0.001)
(0.001)
(0.000)
-0.002***
-0.002**
-0.001**
-0.000*
(0.001)
(0.001)
(0.001)
(0.000)
0.12
0.11
0.10
0.01
35,022
35,022
35,022
35,022
128
128
128
128
District X Year FE
Y
Y
Y
Y
Month FE
Y
Y
Y
Y
Temp& Precip
Y
Y
Y
Y
Robust Standard Errors Clustered at the District level in parentehsis.
P rodci
is measured in hundred sq kms.
The average level of wheat production per district in Pakistan is
4.5 hundred sq kms. *** p<0.01, ** p<0.05, * p<0.1
GTD Dataset (Pakistan).
Additional evidence from the Global Terrorism Dataset (GTD)
shows some evidence in favor some seasonality of conict, though results are not as robust as
using BFRS. Panel A of Table 3 shows that an increase of a hundred square kilometers of wheat
at harvest reduces attacks involving bombs (asymmetric) by around 0.001. Considering that the
average cell cultivates around 0.074 hundred square kilometers of wheat this implies a 7% reduction
attacks on military, police, paramilitary and intelligence targets that employ tactics that conventional forces do not,
such as improvised explosive devices (IEDs). (Bueno de Mesquita et. al. 2015: 17)
30
of attacks evaluated at the average monthly number of total or asymmetric attacks. These results
are consistent in sign but less precisely estimated when clustering the standard errors at the districtlevel (Panel B). When reducing potential measurement error via aggregation, the overall reduction
in violence (column 1 Panel C) is consistent with the ndings from Panel A.
Table 3: Seasonal Labor and Violent Incidents in Pakistan: GTD Data
(1)
(2)
(3)
Panel A: GovXYear Cluster
VARIABLES
Harvcim × P rodci
Mean DV
Observations
GovXYear Cluster
Total
Asym (Bomb)
Laborint (Attack)
-0.001*
-0.001**
0.000
(0.001)
(0.001)
(0.000)
0.001
0.001
0.0008
2,151,950
2,151,950
2,151,950
138
138
138
Panel B: District Cluster
Harvcim × P rodci
Mean DV
Observations
District Cluster
-0.001
-0.001
0.000
(0.002)
(0.001)
(0.001)
0.001
0.001
0.0008
2,151,950
2,151,950
2,151,950
128
128
128
Panel C: Aggregating by District
Harvcim × P rodci
Mean DV
Observations
District Cluster
-0.002**
-0.001
-0.001
(0.001)
(0.001)
(0.001)
0.1
0.07
0.05
35,328
35,328
35,328
128
128
128
District X FE
Y
Y
Y
Month FE
Y
Y
Y
Temp& Precip
Y
Y
Y
Ouliters, dened as above 99th pct, dropped.
P rodci
is measured in hundred square kilometers.
The average level of wheat production per cell/district in Pakistan
is 0.074 /4.51 hundred sq kms. respectively. *** p<0.01, ** p<0.05, * p<0.1
Conclusion
This paper has examined how seasonal variation in labor demand has a negative eect on the
intensity of violence.
In both Iraq and Pakistan, the number of attacks is lower during harvest.
Such a reduction in violent attacks ranges between 4-5% in Pakistan (BFRS data) to 30-40% in
Iraq (WITS dataset) when evaluated at the average number of monthly attacks and the average
amount of wheat cultivated by cell/district.
The main results are robust to excluding regions
that are not wheat producers, a wide array of xed eect variables, and do not appear to be
31
driven by alternative explanations such as the weather, religious festivities, within-year variation
in occupations, or seasonal migration. Consistent with our interpretation that harvest aects local
labor markets and conict, we nd that during these months agricultural workers tend to have
higher employment rates non-agricultural workers. However, the way that attacks are coded seems
important:
although there is some evidence of seasonality using the Global Terrorism Dataset,
estimated coecients are usually smaller and/or less precisely estimated.
In terms of policy implications, care should be taken into interpreting our results for the opportunity cost mechanism as evidence in favor of employment programs or permanent forms of
development aid. In theory, the problem is that those policy schemes may have unintended consequences if highly persistent. For example, a permanent wage or employment subsidy scheme may
mean that households are wealthy enough to devote time to ghting for causes they care about, or
are less likely to provide information to counter-insurgency forces. Or, they may encourage people
to ght in order to capture the rents from these schemes. Similary, permanent changes in productivity (due to foreign or development aid) may have a reduced eect of zero on violence, as rst
mentioned in Fearon (2008).
However, it might be possible to design more sophisticated policies which increase the opportunity cost of violence without increasing either consumption or the value of winning. For example,
reducing food and energy subsidies (which are pervasive in regions prone to conict) and using the
money for an employment subsidy would have little eect on the marginal utility of consumption
but would increase the incentive to work rather than ght. Funding employment schemes by local
taxes would have a similar eect.
Making employment subsidies conditional a successful coun-
terinsurgency means they would not aect the value of winning. These are just ideas: a thorough
assessment would be an interesting area for future research.
32
References
[1] Arjona AM and Kalyvas SN (2008) Rebelling against rebellion:
Comparing insurgent and
counterinsurgent recruitment. Working paper. Yale, CT: Yale University.
[2] Bazzi, S., and Blattman, C. (2014). Economic shocks and conict: Evidence from commodity
prices. American Economic Journal: Macroeconomics, 6(4), 1-38.
[3] Becker, G. 1968. Crime and Punishment: An Economic Approach. Journal of Political Econ-
omy 76(2):169-217.
[4] Berman, E, J N. Shapiro and J H. Felter. 2011a. Can Hearts and Minds be Bought?
The
Economics of Counterinsurgency in Iraq. Journal of Political Economy 119:766-819.
[5] Berman, E, M Callen, J H. Felter and J N. Shapiro. 2011b. Do Working Men Rebel?
In-
surgency and Unemployment in Afghanistan, Iraq, and the Philippines. Journal of Conict
Resolution 55(4)
[6] Blattman C and Miguel E (2010) Civil war. Journal of Economic Literature 48(1): 357.
[7] Blattman C and Ralston L (2015) Generating employment in poor and fragile states: Evidence
from labor market and entrepreneurship programs. Mimeo.
[8] Bertrand M., E. Duo and S. Mullianathan (2004) Hoe much should we trust dierences-indierences estimates? The Quarterly Journal of Economics 119 (1)
[9] Brückner, Markus, and Antonio Ciccone. "International Commodity Prices, Growth and the
Outbreak of Civil War in Sub-Saharan Africa." The Economic Journal 120, no. 544 (2010):
519-534.
[10] Bueno de Mesquita, E. (2013). Rebel tactics. Journal of Political Economy, 121(2), 323-357.
[11] Bueno de Mesquita, et. al. (2014). Measuring political violence in Pakistan: Insights from the
BFRS Dataset. Conict Management and Peace Science.
[12] Burke, M. B., Miguel, E., Satyanath, S., Dykema, J. A., & Lobell, D. B. (2009). Warming
increases the risk of civil war in Africa. Proceedings of the National Academy of Sciences,
106(49), 20670-20674.
[13] Ciccone, A. (2011). Economic shocks and civil conict:
A comment. American Economic
Journal: Applied Economics, 3(4), 215-227.
[14] Chassang S and Padró i Miquel G (2009) Econmic shocks and civil war. Quarterly Journal of
Political Science 4(3): 211228.
33
[15] Collier P and Hoeer A (2004) Greed and grievance in civil war. Oxford Economic Papers
56(4): 563595.
[16] Crost, B., Felter, J., & Johnston, P. (2014). Aid under re: Development projects and civil
conict. The American Economic Review, 104(6), 1833-1856.
[17] Dal Bo, Ernesto, and Dal Bo, Pedro. (2011). Workers, warriors, and criminals: social conict
in general equilibrium.Journal of the European Economic Association, 9(4), 646-677.
[18] Dube, Oeindrila, and Juan F. Vargas. "Commodity price shocks and civil conict: Evidence
from Colombia." The Review of Economic Studies 80, no. 4 (2013): 1384-1421.
[19] Fearon J. (2005) Primary commodity exports and civil war. Journal of Conict Resolution
49(4): 483507.
[20] Fearon J. and Laitin D. (2003) Ethnicity, insurgency, and civil war. American Political Science
Review 97(1): 7590.
[21] Fearon, J. (2008). Economic development, insurgency, and civil war. Institutions and economic
performance, 292, 328.
[22] Figes, Orlando (1996). A People's Tragedy: The Russian Revolution 18911924. Pimlico, London.
[23] Garnkel, Michelle R. 1990. Arming as a Strategic Investment in a Cooperative Equilibrium.
American Economic Review, 80(1): 5068.
[24] Garnkel, Michelle R., and Stergios Skaperdas. 2007. Economics of Conict: An Overview. In
Handbook of Defense Economics, Volume 2, Defense in a Globalized World, ed. Todd Sandler,
and Keith Hartley, 649710. Amsterdam and Oxford: Elsevier, North-Holland.
[25] Giure, K. A. (1997). First in Flight: Desertion as Politics in the North Carolina Confederate
Army. Social Science History, 245-263.
[26] Grossman, Herschel I. 1991. A General Equilibrium Model of Insurrections. American Eco-
nomic Review, 81(4): 91221.
[27] Guardado, J. 2015. Land Tenure, Price Shocks and Insurgency:
Evidence from Peru and
Colombia. Mimeo.
[28] Haavelmo, Trygve. 1954. A Study in the Theory of Economic Evolution. Amsterdam: NorthHolland.
[29] Hirshleifer, Jack. 1988. The Analytics of Continuing Conict. Synthese, 76(2): 20133.
34
[30] Hirshleifer, Jack. 1989. Conict and Rent-Seeking Success Functions:
Ratio vs. Dierence
Models of Relative Success. Public Choice, 63(2): 10112.
[31] Hodler, Roland, and Paul A. Raschky. "Economic shocks and civil conict at the regional
level." Economics Letters 124, no. 3 (2014): 530-533.
[32] Horowitz, Donald L. 1985. Ethnic Groups in Conict. Berkeley and London: University of
California Press.
[33] Hsiang, S. M., Burke, M., and Miguel, E. (2013). Quantifying the inuence of climate on human
conict. Science, 341(6151), 1235367.
[34] Miguel, Edward, Shanker Satyanath and Ernest Sergenti. 2004. Economic Shocks and Civil
Conict: An Instrumental Variables Approach. Journal of Political Economy 112:725-753
[35] Nunn, N., & Qian, N. (2014). US food aid and civil conict. The American Economic Review,
104(6), 1630-1666.
[36] Paxson, C. H. (1992). Using weather variability to estimate the response of savings to transitory
income in Thailand. The American Economic Review, 15-33.
[37] Sarsons,
Heather.
"Rainfall
and
conict."
In
Manuscript.
http://www.
econ.
yale.
edu/conference/neudc11/papers/paper_199. pdf. 2011.
[38] Skaperdas, Stergios. 1992. Cooperation, Conict, and Power in the Absence of Property
Rights. American Economic Review, 82(4): 72039.
[39] Watkin, K., & Norris, A. J. (2012). Non-international Armed Conict in the Twenty-rst
Century. Government Printing Oce.
[40] Wigle, J. (2010). Introducing the worldwide incidents tracking system (WITS). Perspectives
on Terrorism, 4(1).
[41] Willmott,
and
C.
J.
Precipitation:
and
K.
Monthly
Matsuura
and
(2001)
Annual
Terrestrial
Time
Series
Air
(1950
Temperature
-
1999),
http://climate.geog.udel.edu/~climate/html_pages/README.ghcn_ts2.html.
[42] Wood, E. J. (2003). Insurgent collective action and civil war in El Salvador. Cambridge University Press.
35
Theoretical Appendix
Model 1: Rebellion for a Cause or Grievance
Static Model
Another way to see the bias is solve explicitly for violence as a function of wages, after substituting out consumption.
36 of Equation 5, and constraint 2, the
Taking a log-linear approximation
x̂ = lnX − lnX̄
expression for violence becomes Equation 37. Here
viation from steady state, and
X̄
represents the percentage de-
represents the value around which we are approximating (the
non-stochastic steady state in a dynamic model).
v̂ =
(1 − V̄ )(σ − 1)
ŵ
γ(1 − V̄ ) + σ V̄
(37)
From Equation 37, one can see that the relative strength of the income and substitution eects
depends on the size of
σ
(risk aversion). For
σ=0
(linear utility), all income eects are removed
and a simple uni-variate regression uncovers the true elasticity
−1/γ .
If
0 < σ < 1, the substitution
eect dominates the income eect: the coecient on wages is still negative, but is biased upwards.
For
σ = 1 (log
preferences), the income and substitution eects exactly cancel, so there is no eect
of wages on violence. Finally, in the case where
σ > 1:
the marginal utility of consumption changes
so much that an increase in wages actually increases consumption.
Table 4: Parameters for Model Simulations
True Opp. cost (−γ
−1
γ
ψ
σ
W̄
Ā
β
λ
α
V̄
ρLIT
Estimated Elasticity
(1) Rebel for A Cause
-3
1/3
0.5
2
1
-
0.99
-
-
0.07
0.96
-1.5
(2) Rebel for Money
-3
1/3
0.015
-
-
1
0.99
3/4
0.5
0.07
0.96
-1.5
Model
36 The
)
log-linear approximation is a rst order Taylor series approximation of the model's FOCs and bud-
get/resource constraints. The log part refers to the fact that we perform the Taylor's series approximation with
respect to
logXt
rather than
Xt
(i.e. rewrite
Xt = elogXt )).
36
Figure 11: Rebel for a Cause Model: simulated data
37
Empirical Appendix
Iraq
Table 5: Seasonal Labor and Violence: Disaggregating Types (WITS)
VARIABLES
(1)
(2)
(3)
(4)
(5)
Armed Attack
Assault
IED
Suicide
Bombing
Panel A: GovXYear Cluster
Harvcim × P rodci
Mean DV
Observations
-0.450***
-0.009***
-0.453***
-0.051***
-0.459***
(0.098)
(0.002)
(0.108)
(0.017)
(0.109)
0.024
0.0003
0.021
0.002
0.021
371,242
371,242
371,242
371,242
371,242
119
119
119
119
119
GovXYear Clusters
Panel B: District Cluster
Harvcim × P rodci
Mean DV
Observations
-0.450**
-0.009***
-0.453**
-0.051*
-0.459**
(0.195)
(0.003)
(0.208)
(0.026)
(0.210)
0.024
0.0003
0.021
0.002
0.021
371,242
371,242
371,242
371,242
371,242
101
101
101
101
101
District Clusters
Panel C: Aggregating by District
Harvcim × P rodci
-0.739**
-0.380**
-0.006
-0.331*
-0.038
(0.355)
(0.174)
(0.005)
(0.174)
(0.031)
Mean DV
1.067
0.015
0.95
0.12
0.96
Observations
8,484
8,484
8,484
8,484
8,484
District Clusters
101
101
101
101
101
District X Year FE
Y
Y
Y
Y
Y
Month FE
Y
Y
Y
Y
Y
Temp & Precip
Y
Y
Y
Y
Y
Planting
Y
Y
Y
Y
Y
Outliers, dened as above 99th pct, dropped.
P rodci
is measured in hundred sq kilometers.
The average level wheat production for Iraqi cells / district
is 0.019 / 0.86 hundred sq kilometers, respectively
*** p<0.01, ** p<0.05, * p<0.1
38
Table 6: Seasonal Labor and Violence: WITS Data and Dropping Cells with No Wheat Production
VARIABLES
(1)
(2)
(3)
(4)
Total
Asym
Laborint
Victimcoun
Panel A: GovXYear Cluster
Harvcim × P rodci
Observations
Gov X Year
-1.025***
-0.531***
-0.497***
-1.432***
(0.233)
(0.128)
(0.117)
(0.329)
141,586
141,586
141,586
141,586
119
119
119
119
Panel B: District Cluster
Harvcim × P rodci
Observations
District Clusters
-1.025**
-0.531**
-0.497**
-1.432**
(0.470)
(0.253)
(0.218)
(0.659)
141,586
141,586
141,586
141,586
100
100
100
100
Panel C: Aggregating by District
Harvcim × P rodci
-0.735**
-0.367*
-0.378**
-1.013**
(0.355)
(0.204)
(0.175)
(0.489)
8,400
8,400
8,400
8,400
100
100
100
100
District by Year FE
Y
Y
Y
Y
Month FE
Y
Y
Y
Y
Year FE
Y
Y
Y
Y
Planting
Y
Y
Y
Y
Temp& Precip
Y
Y
Y
Y
Observations
District Clusters
Outliers, dened as above 99th pct, dropped.
P rodci
is measured in hundred sq kilometers.
The average level wheat production for Iraqi cells / district
is 0.019 / 0.86 hundred sq kilometers, respectively
*** p<0.01, ** p<0.05, * p<0.1
39
Table 7: Seasonal Labor and Violence: WITS Data and Only Cells Ever in Conict
VARIABLES
(1)
(2)
(3)
(4)
Total
Asym
Laborint
Victimcoun
Panel A: GovXYear Cluster
Harvcim × P rodci
Observations
GovXYear Clusters
-4.273***
-2.219***
-1.965***
-6.046***
(1.081)
(0.524)
(0.594)
(1.499)
23,482
23,482
23,482
23,482
119
119
119
119
Panel B: District Cluster
Harvcim × P rodci
Observations
District Clusters
-4.273*
-2.219**
-1.965*
-6.046*
(2.171)
(1.072)
(1.068)
(3.039)
23,482
23,482
23,482
23,482
79
79
79
79
Panel C: Aggregating by District
Harvcim × P rodci
Observations
-0.751*
-0.374*
-0.386**
-1.035*
(0.379)
(0.217)
(0.188)
(0.522)
8,148
8,148
8,148
8,148
District Clusters
97
97
97
97
District by Year FE
Y
Y
Y
Y
Month FE
Y
Y
Y
Y
Planting
Y
Y
Y
Y
Temp& Precip
Y
Y
Y
Y
Outliers, dened as above 99th pct, dropped.
P rodci
is measured in hundred sq kilometers.
The average level wheat production for Iraqi cells / district
is 0.019 / 0.86 hundred sq kilometers, respectively
*** p<0.01, ** p<0.05, * p<0.1
40
Table 8: Seasonal Labor and Violence: Share of Violence Types of Total in WITS Data
(1)
(2)
(3)
(4)
% Attack
% Suicide
% Assault
Panel A: GovXYear Cluster
VARIABLES
Harvcim × P rodci
Observations
GovXYear Clusters
% IED
-0.141
0.036
-0.143
-0.064
(0.405)
(0.449)
(0.232)
(0.052)
3,661
3,661
3,661
3,661
114
114
114
114
% Attack
% Suicide
% Assault
Panel B: District Cluster
VARIABLES
Harvcim × P rodci
Observations
District Clusters
% IED
-0.141
0.036
-0.143
-0.064
(0.391)
(0.488)
(0.260)
(0.052)
3,661
3,661
3,661
3,661
79
79
79
79
% Attack
% Suicide
% Assault
Panel C: Aggregating by District
VARIABLES
Harvcim × P rodci
Observations
% IED
-0.033**
0.012
-0.008
0.002
(0.015)
(0.014)
(0.018)
(0.003)
2,176
2,176
2,176
2,176
District Clusters
79
79
79
79
District X Year FE
Y
Y
Y
Month FE
Y
Y
Y
Planting
Y
Y
Y
Temp& Precip
Y
Y
Y
Outliers, dened as above 99th pct, dropped.
P rodci
is measured in hundred sq kilometers.
The average level wheat production for Iraqi cells / district
is 0.019 / 0.86 hundred sq kilometers, respectively
*** p<0.01, ** p<0.05, * p<0.1
41
Table 9: Seasonal Labor and Violent Incidents in Iraq: GTD Data
VARIABLES
(1)
(2)
(3)
Total Att
Asymm
Laborint
Panel A: GovXYear Cluster
Harvcim × P rodci
Mean DV
Observations
GovXYear Cluster
-0.096*
-0.084*
-0.031
(0.052)
(0.047)
(0.020)
0.024
0.022
0.007
371,256
371,256
371,256
119
119
119
Panel B: District Cluster
Harvcim × P rodci
Mean DV
Observations
District Cluster
-0.096
-0.084
-0.031
(0.119)
(0.106)
(0.040)
0.024
0.022
0.007
371,256
371,256
371,256
101
101
101
Panel C: District Aggregate
Harvcim × P rodci
Mean DV
Observations
District Cluster
0.042
0.045
0.002
(0.032)
(0.034)
(0.018)
1.08
0.97
0.35
8,484
8,484
8,484
101
101
101
District X Year FE
Y
Y
Y
Month FE
Y
Y
Y
Temp& Precip
Y
Y
Y
Planting
Y
Y
Y
Outliers, dened as above 99th pct, dropped.
P rodci
is measured in hundred sq kilometers.
The average level wheat production for Iraqi cells/district
is 0.019/0.86 hundred sq kms, respectively.
*** p<0.01, ** p<0.05, * p<0.1
42
Table 10: Seasonal Labor and Violent Incidents in Iraq: GTD Dataset - Disaggregating types of
violence.
VARIABLES
(1)
(2)
(3)
(4)
(5)
guerrilla
suicide
attack
bomb
total
Panel A: GovXYear Cluster
Harvcim × P rodci
Observations
GovXYear Cluster
-0.010*
-0.005
-0.031
-0.080*
-0.096*
(0.006)
(0.009)
(0.020)
(0.043)
(0.052)
371,256
371,256
371,256
371,256
371,256
119
119
119
119
119
Panel B: District Cluster
Harvcim × P rodci
Observations
District Cluster
-0.010
-0.005
-0.031
-0.080
-0.096
(0.008)
(0.015)
(0.040)
(0.092)
(0.119)
371,256
371,256
371,256
371,256
371,256
101
101
101
101
101
Panel C: Aggregating by District
Harvcim × P rodci
-0.010
-0.005
-0.031
-0.080
-0.096
(0.008)
(0.015)
(0.040)
(0.092)
(0.119)
8,484
8,484
8,484
8,484
8,484
101
101
101
101
101
District X Year FE
Y
Y
Y
Y
Y
Month FE
Y
Y
Y
Y
Y
Planting
Y
Y
Y
Y
Y
Temp& Precip
Y
Y
Y
Y
Y
Observations
District Clusters
Outliers, dened as above 99th pct, dropped.
P rodci
is measured in hundred sq kilometers.
The average level wheat production for Iraqi cells / district
is 0.019 / 0.86 hundred sq kilometers, respectively
*** p<0.01, ** p<0.05, * p<0.1
43
Table 11: Seasonal Labor and Violent Incidents in Iraq: Share of Violence Types in GTD Data
VARIABLES
(1)
(2)
(3)
(4)
% Guerrilla
% Suicide
% Bomb
% Attack
Panel A: GovXYear Cluster
Harvcim × P rodci
Observations
0.010
0.376
0.313
-0.323
(0.132)
(0.396)
(0.531)
(0.543)
1,799
1,799
1,799
1,799
100
100
100
100
GovXYear Cluster
Panel B: District Clusters
Harvcim × P rodci
Observations
District Clusters
0.010
0.376
0.313
-0.323
(0.154)
(0.369)
(0.603)
(0.585)
1,799
1,799
1,799
1,799
66
66
66
66
Panel C: Aggregating by District
Harvcim × P rodci
Observations
-0.006
0.006
0.003
-0.007
(0.010)
(0.017)
(0.024)
(0.024)
1,369
1,369
1,369
1,369
District Clusters
66
66
66
66
District X Year FE
Y
Y
Y
Y
Month FE
Y
Y
Y
Y
Planting
Y
Y
Y
Y
Temp& Precip
Y
Y
Y
Y
Outliers, dened as above 99th pct, dropped.
P rodci
is measured in hundred sq kilometers.
The average level wheat production for Iraqi cells / district
is 0.019 / 0.86 hundred sq kilometers, respectively
*** p<0.01, ** p<0.05, * p<0.1
44
We show the results using measures of insurgent activity based on reports by Coalition Forces
(SIGACTS)
37 aggregated at the district-month-level by Berman et. al. (2011a). Although this
dataset appears to be more comprehensive than others, it has the limitation that it only records
violent incidents witnessed by coalition forces thus undercounts instances in which they are not
present. Therefore, if Coalition Forces are deployed in non-random ways across wheat producing
areas during harvest, this will tend to over or under report actual instances of violence. Results in
Table 12 shows that these ndings are indicative of a reduction in the number of attacks during
harvest period, but these should be interpreted with caution because they are somewhat sensitive
to the specication used and scaling of the dependent variable.
Table 12: Seasonal Labor and Violent Incidents in Iraq: SIGACTS Data
VARIABLES
(1)
(2)
(3)
SIGACT
DirFire
IED + Suic
-0.001*
-0.0004
-0.0004**
(0.001)
(0.000)
(0.000)
-0.001***
-0.0002*
-0.0005**
(0.000)
(0.000)
(0.000)
Harvim × P rodi
P lantim × P rodi
Mean DV
Observations
Clusters
2.78
1.18
1.45
5,985
5,985
5,985
101
101
101
Month FE
Y
Y
Y
Year FE
Y
Y
Y
Temp& Precip
Y
Y
Y
Following Berman et.al. 2011a, we cluster standard errors at the district level and estimate
the coecients using rst dierences.
Incidents (DV) are normalized by number of cells per district.
Estimate equation is
*** p<0.01, ** p<0.05, * p<0.1
37 This
data has been used in a number of other papers. For instance, in Berman et. al. (2011a); Berman et. al.
(2011b); Shapiro and Weidmann (2015).
45
Figure 12: Time Use Survey: Religious Activities per Month
Coecients from a regression of hours spent on religious activities (In a given day, how many hours do
you spend on...?) on agricultural worker status or not. Additional controls include: individual's age,
level of education, gender, household size and language (Arab or not). We include governorate xed
eects and cluster the standard errors at the survey cluster.
46
Pakistan (1988-2010)
Figure 13: HARVESTING CALENDAR - PAKISTAN - DISTRICT LEVEL
Table 13: Seasonal Labor and Violent Incidents in Pakistan: Share of Violence Types in BFRS
Data
VARIABLES
Harvcim × P rodci
P lancim × P rodci
Observations
(1)
(2)
(3)
(4)
% Milit
% Asym
% Convent
% State
0.000
-0.000
0.000
0.001
(0.001)
(0.003)
(0.003)
(0.002)
0.001
0.002
-0.002
-0.002
(0.001)
(0.004)
(0.004)
(0.001)
2,743
2,667
2,667
2,667
Clusters
95
95
95
95
District X Year FE
Y
Y
Y
Y
Month FE
Y
Y
Y
Y
Temp& Precip
Y
Y
Y
Y
Robust Standard errors Clustered at the District level.
*** p<0.01, ** p<0.05, * p<0.1
47