A G U M
advertisement

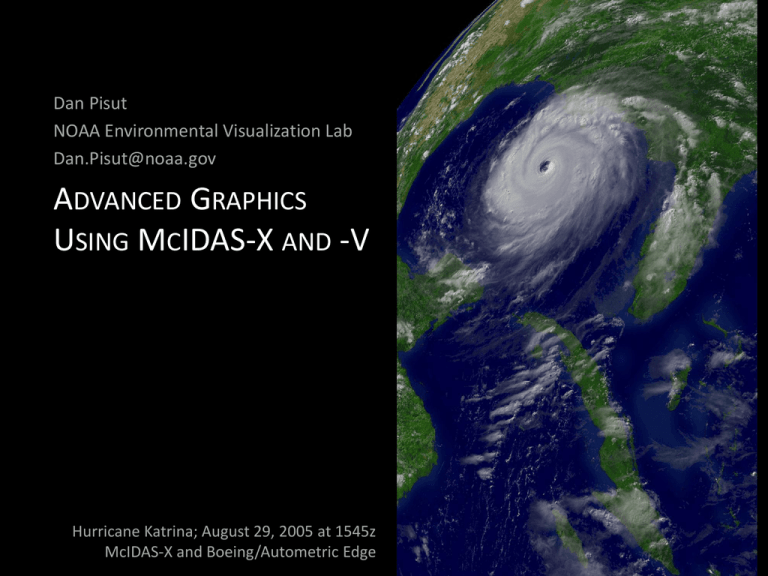
Dan Pisut NOAA Environmental Visualization Lab Dan.Pisut@noaa.gov ADVANCED GRAPHICS USING MCIDAS-X AND -V Hurricane Katrina; August 29, 2005 at 1545z McIDAS-X and Boeing/Autometric Edge Top 10 Reasons to Love McIDAS ① Shapefiles ② Any netCDF ③ Custom analysis ④ Real-time access ⑤ Consolidated access ⑥ Flexibility ⑦ Free ⑧ Time saver ⑨ Resolution ⑩ Batch processing Top 10 Reasons to Love McIDAS ① Shapefiles ② Any netCDF ③ Custom analysis ④ Real-time access ⑤ Consolidated access ⑥ Flexibility ⑦ Free ⑧ Time saver ⑨ Resolution ⑩ Batch processing Top 10 Reasons to Love McIDAS ① Shapefiles ② Any netCDF ③ Custom analysis ④ Real-time access ⑤ Consolidated access ⑥ Flexibility ⑦ Free ⑧ Time saver ⑨ Resolution ⑩ Batch processing Top 10 Reasons to Love McIDAS ① Shapefiles ② Any netCDF ③ Custom analysis ④ Real-time access ⑤ Consolidated access ⑥ Flexibility ⑦ Free ⑧ Time saver ⑨ Resolution ⑩ Batch processing Top 10 Reasons to Love McIDAS ① Shapefiles ② Any netCDF ③ Custom analysis ④ Real-time access ⑤ Consolidated access ⑥ Flexibility ⑦ Free ⑧ Time saver ⑨ Resolution ⑩ Batch processing Top 10 Reasons to Love McIDAS ① Shapefiles ② Any netCDF ③ Custom analysis ④ Real-time access ⑤ Consolidated access ⑥ Flexibility ⑦ Free ⑧ Time saver ⑨ Resolution ⑩ Batch processing Top 10 Reasons to Love McIDAS ① Shapefiles ② Any netCDF ③ Custom analysis ④ Real-time access ⑤ Consolidated access ⑥ Flexibility ⑦ Free ⑧ Time saver ⑨ Resolution ⑩ Batch processing Top 10 Reasons to Love McIDAS ① Shapefiles ② Any netCDF ③ Custom analysis ④ Real-time access ⑤ Consolidated access ⑥ Flexibility ⑦ Free ⑧ Time saver ⑨ Resolution ⑩ Batch processing Top 10 Reasons to Love McIDAS ① Shapefiles ② Any netCDF ③ Custom analysis ④ Real-time access ⑤ Consolidated access ⑥ Flexibility ⑦ Free ⑧ Time saver ⑨ Resolution: 10,000 x 10,000 pixels? Yes please! ⑩ Batch processing Top 10 Reasons to Love McIDAS ① Shapefiles ② Any netCDF ③ Custom analysis ④ Real-time access ⑤ Consolidated access ⑥ Flexibility ⑦ Free ⑧ Time saver ⑨ Resolution ⑩ Batch processing Simple The Evolution of Visualization Simple Complex The Evolution of Visualization Simple Complex Simple The Evolution of Visualization Rules of Color in Visualization Hue Saturation Brightness Most people don’t see things the same way as scientists Rogowitz, Bernice and Alan Kalvin, "The 'Which Blair Project:" A Quick Visual Method For Evaluating Color Maps,” Proceedings. IEEE Visualization Conference, San Diego, CA, October 21-26, pp. 183-188, 2001 Can you see similar patterns in grayscale and color? THE LITMUS TEST http://en.wikipedia.org/wiki/Color_blindness#Design_implications_of_color_blindness Uses NAM CAPE product and wind barbs Visualizing the conditions setting up for major tornado outbreaks Output multiple map outlines data layers separately Layering the displays Same concept, different data Layering the displays Colorbrewer2.org Plan or test your color treatments Questions? Dan Pisut Dan.Pisut@noaa.gov www.nnvl.noaa.gov

