What are we collecting? How do we collect it?
advertisement

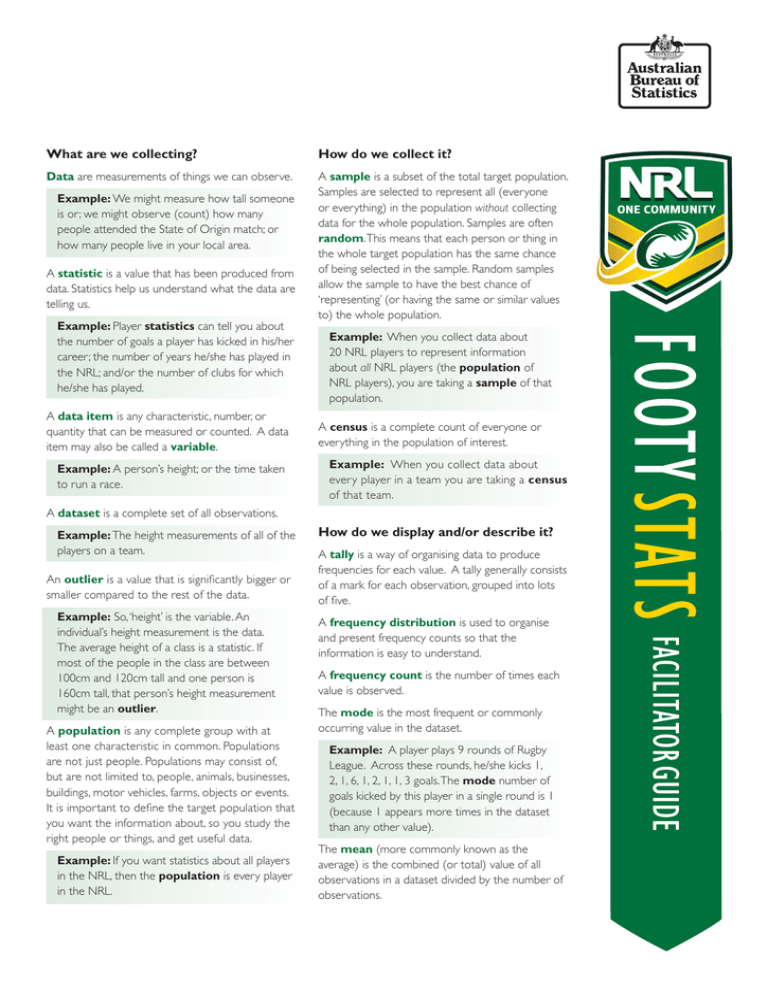
What are we collecting? How do we collect it? Data are measurements of things we can observe. A sample is a subset of the total target population. Samples are selected to represent all (everyone or everything) in the population without collecting data for the whole population. Samples are often random. This means that each person or thing in the whole target population has the same chance of being selected in the sample. Random samples allow the sample to have the best chance of ‘representing’ (or having the same or similar values to) the whole population. Example: We might measure how tall someone is or; we might observe (count) how many people attended the State of Origin match; or how many people live in your local area. A statistic is a value that has been produced from data. Statistics help us understand what the data are telling us. Example: Player statistics can tell you about the number of goals a player has kicked in his/her career; the number of years he/she has played in the NRL; and/or the number of clubs for which he/she has played. A data item is any characteristic, number, or quantity that can be measured or counted. A data item may also be called a variable. Example: A person’s height; or the time taken to run a race. Example: When you collect data about 20 NRL players to represent information about all NRL players (the population of NRL players), you are taking a sample of that population. A census is a complete count of everyone or everything in the population of interest. Example: When you collect data about every player in a team you are taking a census of that team. A dataset is a complete set of all observations. Example: The height measurements of all of the players on a team. An outlier is a value that is significantly bigger or smaller compared to the rest of the data. Example: So, ‘height’ is the variable. An individual’s height measurement is the data. The average height of a class is a statistic. If most of the people in the class are between 100cm and 120cm tall and one person is 160cm tall, that person’s height measurement might be an outlier. A population is any complete group with at least one characteristic in common. Populations are not just people. Populations may consist of, but are not limited to, people, animals, businesses, buildings, motor vehicles, farms, objects or events. It is important to define the target population that you want the information about, so you study the right people or things, and get useful data. Example: If you want statistics about all players in the NRL, then the population is every player in the NRL. How do we display and/or describe it? A tally is a way of organising data to produce frequencies for each value. A tally generally consists of a mark for each observation, grouped into lots of five. A frequency distribution is used to organise and present frequency counts so that the information is easy to understand. A frequency count is the number of times each value is observed. The mode is the most frequent or commonly occurring value in the dataset. Example: A player plays 9 rounds of Rugby League. Across these rounds, he/she kicks 1, 2, 1, 6, 1, 2, 1, 1, 3 goals. The mode number of goals kicked by this player in a single round is 1 (because 1 appears more times in the dataset than any other value). The mean (more commonly known as the average) is the combined (or total) value of all observations in a dataset divided by the number of observations. Example: A player plays 9 rounds of Rugby League. Across these rounds, he/she kicks 1, 2, 1, 6, 1, 2, 1, 1, 3 goals. The mean number of goals kicked by this player in a single round is 2 (1 + 2 + 1 + 6 + 1 + 2 + 1 + 1 + 3 = 18, and 18 ÷ 9 = 2). The median is the middle value when the dataset is arranged in numerical order from lowest to highest. That is, the median is larger than half of the values and smaller than half of the values. Example: A player plays 9 rounds of Rugby League. Across these rounds, he/she kicks 1, 2, 1, 6, 1, 2, 1, 1, 3 goals. The median number of goals kicked by this player in a single round is 1 because when the dataset are written down in numerical order (instead of the order in which they were collected) – 1, 1, 1, 1, 1, 2, 2, 3, 6 – the middle value is 1. There are an equal number of values on each side of the median value. The mode, median and mean are all measures of central tendency. This means they provide a summary measure that represents the middle of a dataset, or a ‘typical’ value. These measures allow you to describe a dataset with a single value that summarises the data. A proportion describes how much one value of a variable contributes to the total of the responses. It is calculated by dividing the number of times a particular value of a variable has been observed, by the total number of values in the population. Example: In a class of 10 people, if 5 people say their favourite colour is red, then red is the favourite colour of half of the class (5 ÷ 10 = 0.5). A percentage expresses a number as a fraction of 100. A percentage is usually symbolised using the sign %. A percentage is calculated by dividing the number of times a particular value for a variable has been observed, by the total number of observations in the population, then multiplying this number by 100. Example: In a class of 10 people, if 5 people say their favourite colour is red, then red is the favourite colour of 50% of the class (5 ÷ 10 = 0.5 and 0.5 x 100 is 50). A time series is a collection of observations of the same thing over time. Example: The population of Australia changes over time, and is measured once every 5 years by the Census or the number of NRL players changes over time and is measured every year or season. What do we do with it? Data analysis is the process of examining the data to understand events. Example: A coach might analyse the match statistics like the number of tackles, number of goals, time in possession, etc. to see which player is best in each position or how they perform each half. Evidence is information that supports a decision or a judgement. Statistics are one form of evidence. Example: A supporter might use the number of games his team has won as evidence for his decision to keep supporting that team. Interpretation is taking some meaning from the information in front of us. Example: If a player’s performance (measured by match statistics) has been declining, a coach might interpret that the player needs more training, or that he/she might have an injury. We analyse the data to understand it. Based on our analysis, we might interpret things about the data available. Once we’ve made some interpretations, we can use the data as evidence for our decisions or judgements.


