– People Greater Adelaide, South Australia
advertisement

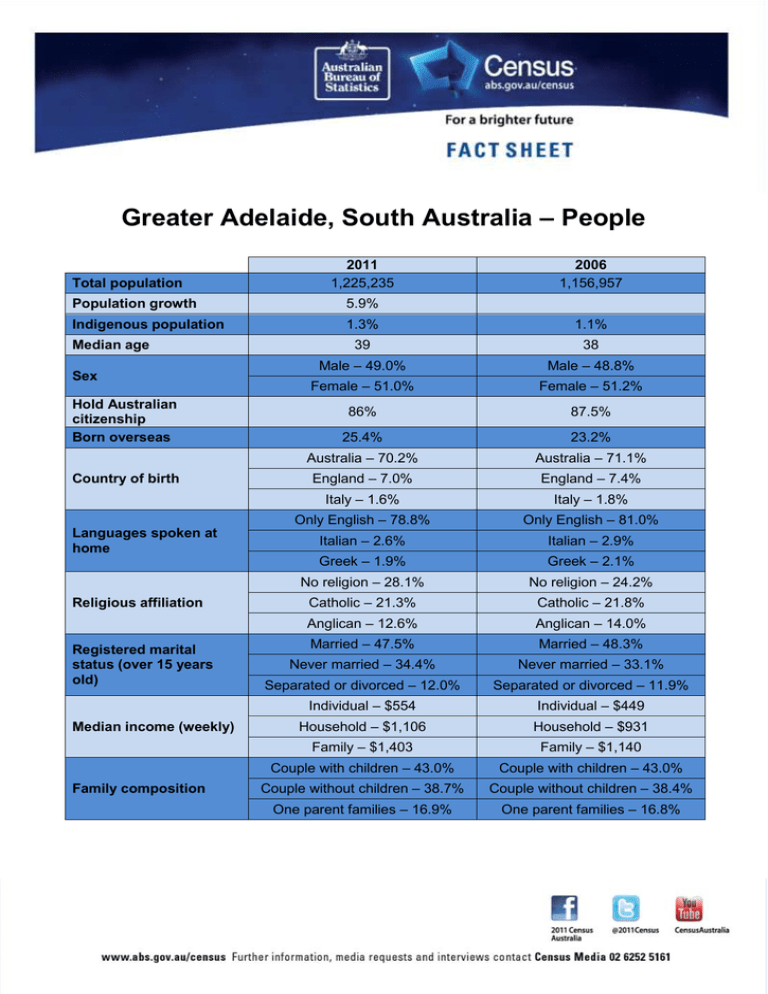
Greater Adelaide, South Australia – People Total population 2011 1,225,235 2006 1,156,957 Population growth 5.9% Indigenous population 1.3% 1.1% 39 38 Male – 49.0% Male – 48.8% Female – 51.0% Female – 51.2% 86% 87.5% 25.4% 23.2% Australia – 70.2% Australia – 71.1% England – 7.0% England – 7.4% Italy – 1.6% Italy – 1.8% Only English – 78.8% Only English – 81.0% Italian – 2.6% Italian – 2.9% Greek – 1.9% Greek – 2.1% No religion – 28.1% No religion – 24.2% Catholic – 21.3% Catholic – 21.8% Anglican – 12.6% Anglican – 14.0% Married – 47.5% Married – 48.3% Never married – 34.4% Never married – 33.1% Separated or divorced – 12.0% Separated or divorced – 11.9% Individual – $554 Individual – $449 Household – $1,106 Household – $931 Family – $1,403 Family – $1,140 Couple with children – 43.0% Couple with children – 43.0% Couple without children – 38.7% Couple without children – 38.4% One parent families – 16.9% One parent families – 16.8% Median age Sex Hold Australian citizenship Born overseas Country of birth Languages spoken at home Religious affiliation Registered marital status (over 15 years old) Median income (weekly) Family composition Greater Adelaide, South Australia – Dwellings Total dwellings Occupied private dwellings Dwelling structure Tenure Household composition Median household rent (weekly) Median household mortgage repayments (monthly) Average people per household Average people per bedroom 2011 2006 534,267 501,167 491,685 465,855 Separate house – 75.8% Separate house – 76.2% Flat/Unit/Apartment – 11.2% Flat/Unit/Apartment – 11.2% Semi-detached – 12.6% Semi-detached – 12.1% Owned outright – 31.5% Owned outright – 33.5% Owned with mortgage – 36.4% Owned with mortgage – 36.0% Rented – 28.1% Single/multi-family household – 68.5% Lone person household – 27.6% Rented – 26.3% Single/multi-family household – 68.6% Lone person household – 27.8% Group household – 3.9% Group household – 3.6% $250 $165 $1,543 $1,083 2.4 2.4 1.1 1.1 Key Points The population of Greater Adelaide has increased from 1,156,957 in 2006 to 1,225,235 in 2011, an increase of 68,278 people. The proportion of people who reported no religious affiliation has increased from 24.2 per cent in 2006 to 28.1 per cent in 2011. Median household weekly rent has increased from $165 in 2006 to $250 in 2011, an increase of $85 per week. Median household monthly mortgage repayments have increased from $1,083 in 2006 to $1,543 in 2011, an increase of $460.


