– People Greater Melbourne, Victoria
advertisement
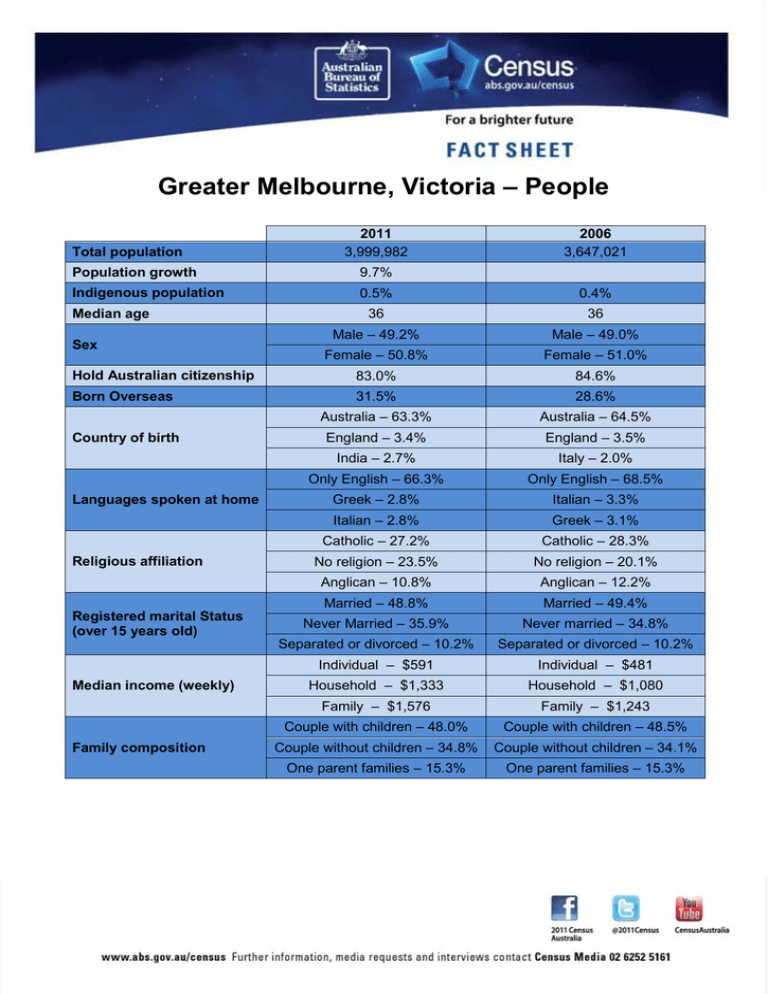
Greater Melbourne, Victoria – People Total population 2011 3,999,982 2006 3,647,021 Population growth 9.7% Indigenous population 0.5% 0.4% 36 36 Male – 49.2% Male – 49.0% Female – 50.8% Female – 51.0% Hold Australian citizenship 83.0% 84.6% Born Overseas 31.5% 28.6% Australia – 63.3% Australia – 64.5% England – 3.4% England – 3.5% India – 2.7% Italy – 2.0% Only English – 66.3% Only English – 68.5% Greek – 2.8% Italian – 3.3% Italian – 2.8% Greek – 3.1% Catholic – 27.2% Catholic – 28.3% No religion – 23.5% No religion – 20.1% Anglican – 10.8% Anglican – 12.2% Married – 48.8% Married – 49.4% Never Married – 35.9% Never married – 34.8% Separated or divorced – 10.2% Separated or divorced – 10.2% Individual – $591 Individual – $481 Household – $1,333 Household – $1,080 Family – $1,576 Family – $1,243 Couple with children – 48.0% Couple with children – 48.5% Couple without children – 34.8% Couple without children – 34.1% One parent families – 15.3% One parent families – 15.3% Median age Sex Country of birth Languages spoken at home Religious affiliation Registered marital Status (over 15 years old) Median income (weekly) Family composition Greater Melbourne, Victoria – Dwellings Total dwellings Occupied private dwellings Dwelling structure Tenure Household composition Median household rent (weekly) Median household mortgage repayments (monthly) Average people per household Average people per bedroom 2011 2006 1,638,628 1,493,611 1,494,663 1,370,069 Separate house – 71.1% Separate house – 71.6% Flat/Unit/Apartment – 16.6% Flat/Unit/Apartment – 16.4% Semi-detached – 11.8% Semi-detached – 11.4% Owned outright – 32.7% Owned outright – 34.7% Owned with mortgage – 36.8% Owned with mortgage – 36.5% Rented – 27.2% Single/multi-family household – 72.0% Lone person household – 23.3% Rented – 25.2% Single/multi-family household – 71.9% Lone person household – 23.7% Group household – 4.7% Group household – 4.4% $300 $200 $1,811 $1,343 2.6 2.6 1.1 1.1 Key Points The population of Greater Melbourne has increased from 3,592,591 in 2006 to 3,999,982 in 2011, an increase of 407,391 people. The proportion of people who reported no religious affiliation has increased from 20 per cent in 2006 to 23.5 per cent in 2011. India is now the third most reported country of birth in Greater Melbourne, accounting for 2.7 per cent of the population. Greek and Italian are now the second most common languages spoken at home other than English. Median household weekly rent has increased from $200 in 2006 to $300 in 2011, an increase of $100 per week. Median household monthly mortgage repayments have increased from $1,343 in 2006 to $1,811 in 2011, an increase of $468.

