Introduction to Product Revision Comparison Spreadsheets
advertisement
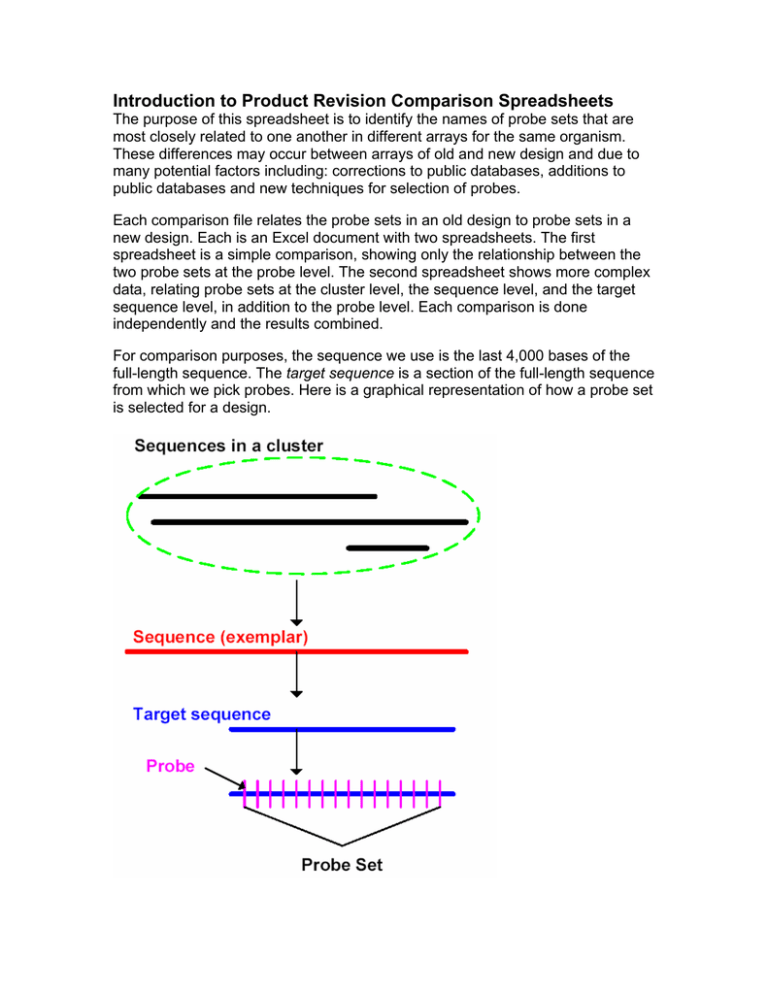
Introduction to Product Revision Comparison Spreadsheets The purpose of this spreadsheet is to identify the names of probe sets that are most closely related to one another in different arrays for the same organism. These differences may occur between arrays of old and new design and due to many potential factors including: corrections to public databases, additions to public databases and new techniques for selection of probes. Each comparison file relates the probe sets in an old design to probe sets in a new design. Each is an Excel document with two spreadsheets. The first spreadsheet is a simple comparison, showing only the relationship between the two probe sets at the probe level. The second spreadsheet shows more complex data, relating probe sets at the cluster level, the sequence level, and the target sequence level, in addition to the probe level. Each comparison is done independently and the results combined. For comparison purposes, the sequence we use is the last 4,000 bases of the full-length sequence. The target sequence is a section of the full-length sequence from which we pick probes. Here is a graphical representation of how a probe set is selected for a design. Description of various fields in the spreadsheet: • old probe set name Probe set name from the old design. • new probe set name Probe set name from the new design. • old->new cluster relationship This is done by comparing the accession numbers in an old cluster to the accession numbers in a new cluster. ♦ identical: every accession number in the old cluster is also in the new cluster. ♦ overlap: some accession numbers overlap between the two clusters, but not all. ♦ none: there are no common accession numbers between the two clusters. • old->new seq. relationship This is done by comparing the last 4000 bases of an old full-length sequence to the last 4000 bases of a new full-length sequence using FASTA comparison. ♦ identical: the old sequence is exactly the same as the new sequence. ♦ overlap: the old and new sequences overlap, but have some mismatches. ♦ none: the two sequences do not overlap at all. • old->new target seq. relationship This is done by comparing the probe selection region of an old full-length sequence to the probe selection region of a new full-length sequence using FASTA comparison. ♦ identical: the two target sequences are exactly the same. ♦ overlap: the two target sequences overlap, but have some mismatches. ♦ none: the two target sequences do not overlap at all. • old->new probe relationship This is done by comparing each probe in an old probe set to each probe in a new probe set. ♦ identical: the old probe set and the new probe set have the exact same set of probes. ♦ overlap: some probes in the old probe set are the same as some probes in the new probe set. However, there can be probe(s) in the old probe set that are absent in the new probe set, or vice-versa. ♦ none: none of the probes in the old probe set matches any of the probes in the new probe set. • matching probes For probe sets that overlap, we show which probe(s) are identical to each other For sequence and target sequence comparisons, we only show the best match from the new design to the old design, and only for sequences that pass one of the following thresholds: • the probability of the two sequences match randomly (pValue) is less than e-40 • % overlap is greater than 90% AND over at least 70 bases However, if the probe set from an old sequence is identical to or overlaps a new probe set, we will show you the sequence comparison results for that particular old and new probe sets, regardless of the thresholds mentioned above. Since this type of sequence comparison is comparing one sequence directly to another sequence, no pValue is calculated. Affymetrix Confidential Part No. 700398 Rev. 1


