Appendix I: Diagnostic Statistics
advertisement

Appendix I: Diagnostic Statistics
Hansen (1997) suggests a distribution theory for least-squares estimates of the threshold in a
similar family of threshold autoregressive (TAR) models as well as a means of forming
likelihood ratio statistics in order to gauge the relative performance of TAR models versus
standard (linear) autoregressive models. The methodology developed by Hansen was adapted
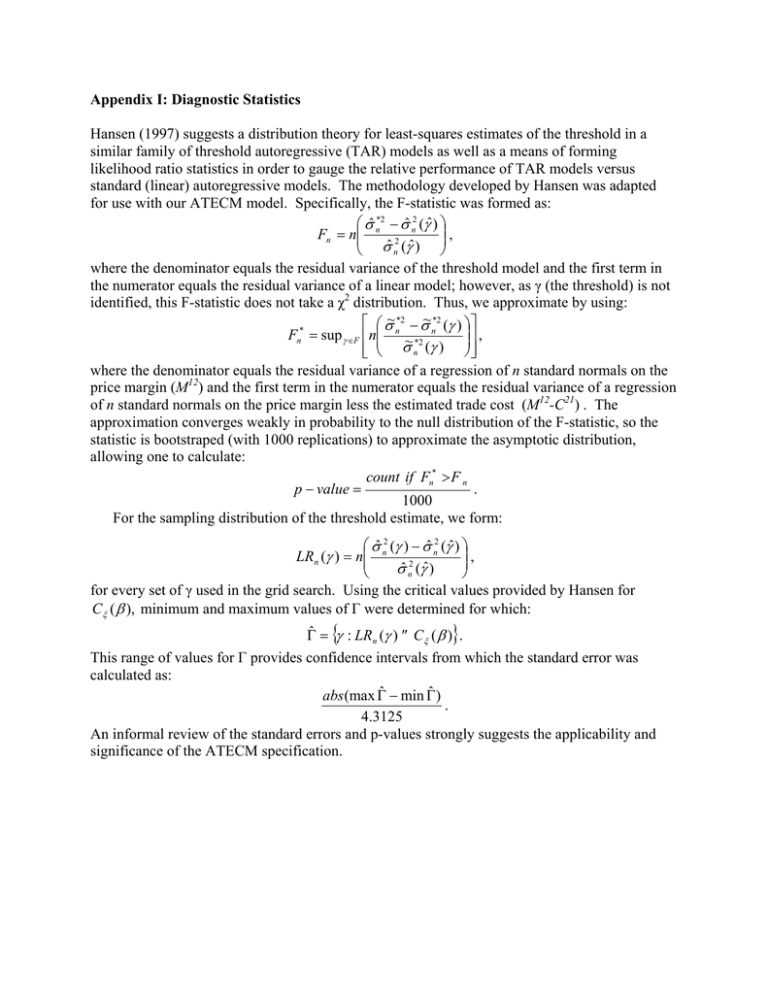
for use with our ATECM model. Specifically, the F-statistic was formed as:
σˆ *2 − σˆ 2 (γˆ )
,
Fn = n n 2 n
σˆ n (γˆ )
where the denominator equals the residual variance of the threshold model and the first term in
the numerator equals the residual variance of a linear model; however, as γ (the threshold) is not
identified, this F-statistic does not take a χ2 distribution. Thus, we approximate by using:
σ~ *2 − σ~ *2 (γ )
,
Fn* = sup γ ∈F n n ~ *2 n
σ n (γ )
where the denominator equals the residual variance of a regression of n standard normals on the
price margin (M12) and the first term in the numerator equals the residual variance of a regression
of n standard normals on the price margin less the estimated trade cost (M12-C21) . The
approximation converges weakly in probability to the null distribution of the F-statistic, so the
statistic is bootstraped (with 1000 replications) to approximate the asymptotic distribution,
allowing one to calculate:
count if Fn* > F n
p − value =
.
1000
For the sampling distribution of the threshold estimate, we form:
σˆ 2 (γ ) − σˆ 2 (γˆ )
,
LRn (γ ) = n n 2 n
ˆ
ˆ
σ
(
γ
)
n
for every set of γ used in the grid search. Using the critical values provided by Hansen for
Cξ ( β ), minimum and maximum values of Γ were determined for which:
Γˆ = {γ : LRn (γ ) ≤ Cξ ( β )}.
This range of values for Γ provides confidence intervals from which the standard error was
calculated as:
abs (max Γˆ − min Γˆ )
.
4.3125
An informal review of the standard errors and p-values strongly suggests the applicability and
significance of the ATECM specification.


