Revisiting Francis Galton’s Forecasting Competition Kenneth F. Wallis
advertisement
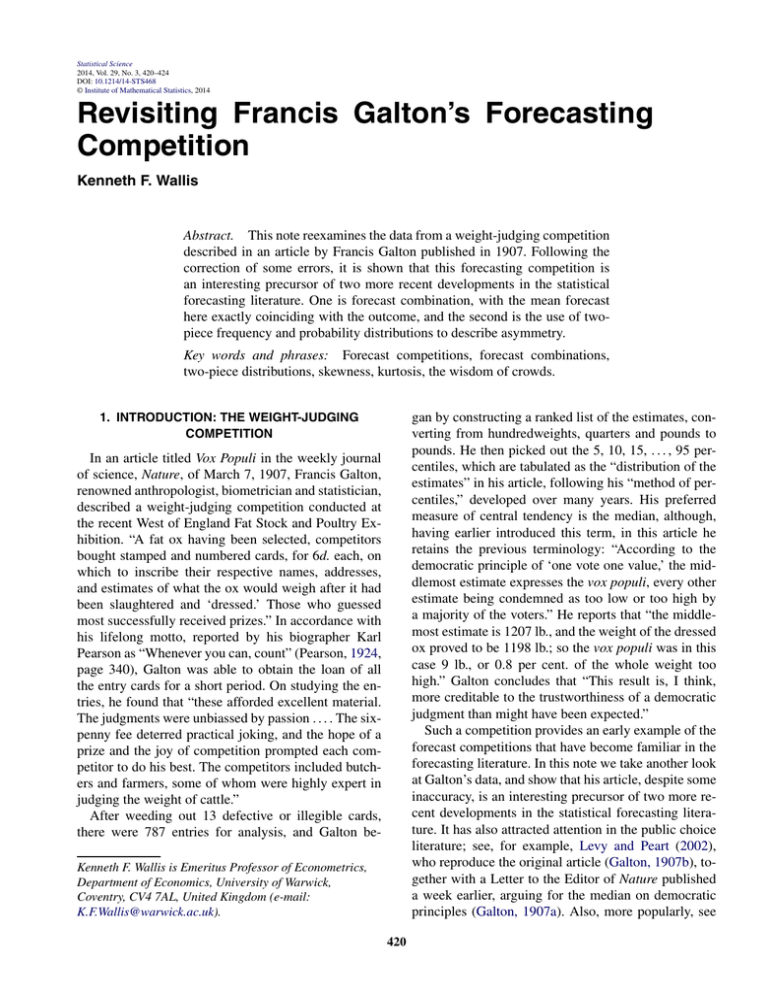
Statistical Science 2014, Vol. 29, No. 3, 420–424 DOI: 10.1214/14-STS468 © Institute of Mathematical Statistics, 2014 Revisiting Francis Galton’s Forecasting Competition Kenneth F. Wallis Abstract. This note reexamines the data from a weight-judging competition described in an article by Francis Galton published in 1907. Following the correction of some errors, it is shown that this forecasting competition is an interesting precursor of two more recent developments in the statistical forecasting literature. One is forecast combination, with the mean forecast here exactly coinciding with the outcome, and the second is the use of twopiece frequency and probability distributions to describe asymmetry. Key words and phrases: Forecast competitions, forecast combinations, two-piece distributions, skewness, kurtosis, the wisdom of crowds. gan by constructing a ranked list of the estimates, converting from hundredweights, quarters and pounds to pounds. He then picked out the 5, 10, 15, . . . , 95 percentiles, which are tabulated as the “distribution of the estimates” in his article, following his “method of percentiles,” developed over many years. His preferred measure of central tendency is the median, although, having earlier introduced this term, in this article he retains the previous terminology: “According to the democratic principle of ‘one vote one value,’ the middlemost estimate expresses the vox populi, every other estimate being condemned as too low or too high by a majority of the voters.” He reports that “the middlemost estimate is 1207 lb., and the weight of the dressed ox proved to be 1198 lb.; so the vox populi was in this case 9 lb., or 0.8 per cent. of the whole weight too high.” Galton concludes that “This result is, I think, more creditable to the trustworthiness of a democratic judgment than might have been expected.” Such a competition provides an early example of the forecast competitions that have become familiar in the forecasting literature. In this note we take another look at Galton’s data, and show that his article, despite some inaccuracy, is an interesting precursor of two more recent developments in the statistical forecasting literature. It has also attracted attention in the public choice literature; see, for example, Levy and Peart (2002), who reproduce the original article (Galton, 1907b), together with a Letter to the Editor of Nature published a week earlier, arguing for the median on democratic principles (Galton, 1907a). Also, more popularly, see 1. INTRODUCTION: THE WEIGHT-JUDGING COMPETITION In an article titled Vox Populi in the weekly journal of science, Nature, of March 7, 1907, Francis Galton, renowned anthropologist, biometrician and statistician, described a weight-judging competition conducted at the recent West of England Fat Stock and Poultry Exhibition. “A fat ox having been selected, competitors bought stamped and numbered cards, for 6d. each, on which to inscribe their respective names, addresses, and estimates of what the ox would weigh after it had been slaughtered and ‘dressed.’ Those who guessed most successfully received prizes.” In accordance with his lifelong motto, reported by his biographer Karl Pearson as “Whenever you can, count” (Pearson, 1924, page 340), Galton was able to obtain the loan of all the entry cards for a short period. On studying the entries, he found that “these afforded excellent material. The judgments were unbiassed by passion . . . . The sixpenny fee deterred practical joking, and the hope of a prize and the joy of competition prompted each competitor to do his best. The competitors included butchers and farmers, some of whom were highly expert in judging the weight of cattle.” After weeding out 13 defective or illegible cards, there were 787 entries for analysis, and Galton beKenneth F. Wallis is Emeritus Professor of Econometrics, Department of Economics, University of Warwick, Coventry, CV4 7AL, United Kingdom (e-mail: K.F.Wallis@warwick.ac.uk). 420 REVISITING FRANCIS GALTON’S FORECASTING COMPETITION 421 Surowiecki’s The Wisdom of Crowds (2004), which begins with the weight-judging competition and so brings it to the attention of a wider audience. 2. A VISIT TO THE ARCHIVES: SOME DISCREPANCIES Galton’s working papers, notes, some correspondence and a handwritten draft of his article are stored in the Galton Archive at University College, London. Study of this material reveals some slips that have a bearing on subsequent analysis and interpretation. Galton reached the age of 85 on February 16, 1907, and may have been in a hurry to attract “immediate attention,” for which Nature provided “a ready means” of communication, as Pearson observed (Pearson, 1924, page 400). There are small errors in all three figures appearing in the summary statement of the results quoted above, although they are arithmetically consistent. First, with respect to the median entry, among 787 observations this is the 394th in the ranked list, which is 1208 pounds. Second, the outcome, that is, the dressed weight of the ox, was reported in a letter from the organiser of the competition as 10 cwt, 2 qt and 21 lbs, that is, 1197 pounds, and this figure appears in Galton’s worksheets, being equal to the 353rd entry in the ranked list, as shown in the extract reproduced in Figure 1. So the true error in the middlemost estimate is 11 lb. Galton devoted a paragraph of a letter to his nephew, Edward Wheler Galton, dated February 4, 1907, to this subject. He says that he is “just now at some statistics that might interest you,” and concludes a brief account of the weight-judging data with the statement “The average was 11 lbs. wrong” (Pearson, 1930, page 581). Galton’s handwritten draft of the article, however, presents the results as follows. “The weight of the dressed ox proved to be 1198 lbs. The estimates were scattered about their own middlemost value of 1208 lbs so the vox populi was in this case 11 lbs too high, or closely 1% of the weight.” Here the arithmetic is inconsistent, because the outcome has been incorrectly transcribed. But instead of correcting 1198 to 1197, so that the difference is 11, as correctly stated in the draft, in the published version 1208 has been changed to 1207, and the error is correspondingly reported as 9 lb. In attempting the correction, the wrong four-digit number has had its final 8 altered to 7. It is not clear at what point in the work this happened, since the wrong median also appears in the published table of the distribution of the estimates, although the first and third quartiles are correctly given. With 787 observations these F IG . 1. Extract from Galton’s worksheets. Galton recorded the rank order(s) of the competitor(s) who chose each possible weight, recorded in pounds. In this relatively dense part of the distribution of estimated weights, it is remarkable that there was only a single winner, and no immediately adjacent runner-up. require no interpolation, being the 197th and 591st observations in the ranked list, equal to 1162 and 1236 respectively. Galton appears to have remained unaware that the results as presented in his article were inaccurate, since they reappear in his Memories of My Life (1908). A short account of his visit to the cattle exhibition “a little more than a year ago” and his subsequent research is given (pages 280–281); this refers to his “memoir published in Nature” and repeats the incorrect numbers to be found there, respectively 1207 pounds and 1198 pounds. 3. FORECAST COMBINATION The idea that combining different forecasts of the same event might be worthwhile has gained wide acceptance since the seminal article of Bates and Granger (1969), some sixty years after Galton’s Vox Populi. A substantial literature has subsequently appeared, mostly concerning point forecasts of the future realisation of a random variable and, although the median of a set of competing forecasts is sometimes a combined forecast of interest, simple averages and various 422 K. F. WALLIS weighted averages are more common, given that the statistical forecasting literature is largely founded on least squares principles. The choice between the median and the mean was discussed in a letter to the editor of Nature published two weeks after Galton’s article had appeared. The correspondent, Hooker (1907), wished that Galton had also reported the arithmetic mean of the 787 observations. He says that “I have not the actual figures, but judging from the data in Mr. Galton’s article, the mean would seem to be approximately 1196 lb., which is much closer to the ascertained weight (1198 lb.) than the median (1207 lb.)”: he had calculated the mean of the percentiles in Galton’s table. In his reply, one week later, Galton (1907c) reports the correct mean of all the figures as 1197 pounds, which for him shows that “the compactness of a table of centiles is no hindrance to their wider use.” He does not remark on the fact that this is closer to the true value than the median, as Hooker had observed. Indeed, using the correct value of the outcome, the mean estimate has zero error. This early example of the gains from forecast combination would very likely have been cited by Bates and Granger (1969), had they been aware of it. Surowiecki focusses on this mean estimate, reported in Galton’s reply, as representative of “the collective wisdom of the Plymouth crowd” (Surowiecki, 2004, page xiii). He compares it to the published outcome of 1198 pounds and concludes that “the crowd’s judgment was essentially perfect.” Had he known the true outcome, his conclusion on the wisdom of crowds would no doubt have been more strongly expressed. In this one-off exercise there is no possibility of using calculated weights to construct an alternative combined forecast. Other possibilities considered in the forecast combination literature include trimmed means: in this case symmetric trimming of the sample by increasing amounts simply moves the estimate from the mean of 1197 towards the median, which is the extreme example of a trimmed mean, and increases the error. 4. TWO-PIECE DISTRIBUTIONS Galton discusses the dispersion and shape of the distribution of the individual forecasts of the dressed weight with reference to the normal distribution. As a measure of spread he uses the “probable error,” an archaic term for the semi-interquartile range: the probability of obtaining a value within one probable error of the centre of a symmetric distribution is 0.5. For normal variables the probable error is equal to 0.6745 × (standard deviation), hence, Galton’s probable error of (1236 − 1162)/2 = 37 is equivalent to a standard deviation of 54.9. To compare the empirical distribution with a normal distribution with mean (= median) 1207 and probable error 37, he plots each distribution’s percentiles against the corresponding percentages (5, 10, . . . , 95); his “ogive” curves are now called inverse cumulative distribution functions. His diagram shows that the normal distribution does not extend sufficiently far into the tails of the empirical distribution. To modern eyes, this is more readily apparent in the comparison of the probability density function (PDF) of Galton’s normal distribution and the sample histogram shown in Figure 2. In the course of an extended review of Galton’s statistical investigations, Pearson (1924), Chapter 13, revisits this data set. In respect of Galton’s methods, he observes (page 400) “That Galton used median and quartiles so frequently . . . must, I think, be attributed to his great love of brief analysis. He found arithmetic in itself irksome;” For the present exercise, he notes (page 404) that “the percentile method of tabulation does not permit of very ready determination of the mean and standard deviation and so of getting the best normal distribution,” in other words, the one fitted by his method of moments! He finds, “after some labour: mean 1197, standard deviation 61.895, . . . . These give a far better fit than Galton’s median and quartile values.” Pearson seems to have overlooked the mean value given by Galton (1907c). Figure 2 shows that his claim of “a far better fit” is true away from the centre of the distribution, but less true around the peak. A major problem, as Galton observes, is that the distribution of forecasts is asymmetric, the extent of underestimation of the outcome being the greater. His final suggestion is that the lower half of the distribution might agree well with a normal distribution with probable error 45, and the upper half with one having probable error 29. He had made a similar suggestion on a previous occasion (Galton, 1896), only to have it immediately pointed out that placing two halfnormal distributions together in this way would result in a discontinuity at the join point (Yule, 1896). The two-piece normal distribution, introduced by Fechner (1897) and subsequently rediscovered several times (Wallis, 2014), appropriately scales each half-normal distribution and is continuous at the mode. This distribution has found widespread use as a representation of asymmetric risks in density forecasting. A second major problem, however, is that the sample distribution is leptokurtic, that is, more peaked and REVISITING FRANCIS GALTON’S FORECASTING COMPETITION 423 F IG . 2. Fitted normal curves. Histogram: original data. Solid line: PDF of the N (1207, 54.9) distribution (Galton). Dashed line: PDF of the N (1197, 61.9) distribution (Pearson). with fatter tails than the normal distribution: the conventional β2 measure of kurtosis is 6.01. The corresponding lack of “shoulders” in the distribution explains why Galton’s estimate of the standard deviation based on the interquartile range is smaller than Pearson’s second moment estimate. In the two-piece normal distribution we have 3 ≤ β2 ≤ 3.87, but this apparent kurtosis is simply a consequence of its asymmetry, with each half-normal distribution being rescaled, not reshaped. Attention then turns to two-piece versions of more kurtotic distributions, such as the Student-t distribution with a relatively small degrees of freedom. However, incorporating skewness in this way mainly accommodates skewness in the central part of the distribution, and does not allow the two tails of the distribution to have different rates of decay. Accordingly, Zhu and Galbraith (2010) develop a class of generalized asymmetric Student-t (AST) distributions which has one skewness parameter and two tail parameters, which offer the possibility of improved fit in the tail regions. Fitting the (CDF of the) AST distribution to Galton’s data by maximum likelihood gives the result shown (as the PDF) in Figure 3. It is seen that the main features of the data are well represented by this five-parameter form, compared to the two-parameter forms shown in Figure 2. Basing model selection on the Akaike information criterion leads to a clear preference for the fiveparameter form over any restricted version of the distribution. The two “degrees of freedom” parameter estimates are 4.97 and 2.73 respectively in the lower and upper pieces of the distribution. The skewness measure of Arnold and Groeneveld (1995), which is equal to the difference between the areas under the PDF above and below the mode, is −0.32. It is hoped that this successful example will encourage further applications of the AST distribution, not only in financial econometrics, for which it was designed, but also in other fields. 5. EPILOGUE Nothing in this account of Galton’s inaccuracies should be taken as detrimental to his standing as a major figure in the development of modern statistics. Stigler (1986), Chapter 8, assesses his contributions, describing him (page 266) as “a romantic figure in the history of statistics, perhaps the last of the gentleman scientists.” More recently (Stigler, 2010), he dates the beginning of the half century that he calls the Statistical Enlightenment from Galton’s address to the 1885 meeting of the British Association for the Advancement of Science. By 1907, however, Galton’s major accomplishments were behind him, and the analysis of the weight-judging data was the last piece of statistical work that he published. He was aged 85, and in poor health, which was the reason for his presence in the West of England. He explained in a letter to his nephew in October 1906 that “London in November would help to, or quite, kill me,” but whereas it had been his custom to spend winters in Southern Europe, “I funk now foreign travel” (Pearson, 1930, page 579). He had not lost his mental powers, however, and, once 424 F IG . 3. 2010). K. F. WALLIS The asymmetric Student-t distribution. Histogram: original data. Solid line: PDF of the fitted AST distribution (Zhu and Galbraith, in Plymouth, could not resist the opportunity that access to these data offered him. Galton died on January 17, 1911, and is buried at Claverdon, a few miles from Warwick. ACKNOWLEDGMENTS My thanks to Gianna Boero, John Galbraith, Federico Lampis, Jeremy Smith, two referees and the Special Collections Librarians at University College, London. Note: facsimiles of the Galton and Pearson items are available at http://www.galton.org/. REFERENCES A RNOLD , B. C. and G ROENEVELD , R. A. (1995). Measuring skewness with respect to the mode. Amer. Statist. 49 34–38. MR1341197 BATES , J. M. and G RANGER , C. W. J. (1969). The combination of forecasts. Operational Research Quarterly 20 451–468. F ECHNER , G. T. (ed. LIPPS, G. F.) (1897). Kollektivmasslehre. Engelmann, Leipzig. G ALTON , F. (1896). Application of the method of percentiles to Mr. Yule’s data on the distribution of pauperism. J. Roy. Statist. Soc. 59 392–396. G ALTON , F. (1907a). Letters to the Editor: One vote, one value. Nature 75 414. (February 28, 1907.) G ALTON , F. (1907b). Vox populi. Nature 75 450–451. (March 7, 1907.) G ALTON , F. (1907c). Letters to the Editor: The ballot-box. Nature 75 509–510. (March 28, 1907.) G ALTON , F. (1908). Memories of My Life. Methuen, London. H OOKER , R. H. (1907). Letters to the Editor: Mean or median. Nature 75 487–488. (March 21, 1907.) L EVY, D. M. and P EART, S. (2002). Galton’s two papers on voting as robust estimation. Public Choice 113 357–365. P EARSON , K. (1924). The Life, Labours and Letters of Francis Galton: Vol. 2, Researches of Middle Life. Cambridge Univ. Press, Cambridge. P EARSON , K. (1930). The Life, Labours and Letters of Francis Galton: Vol. 3B, Characterization, Especially by Letters, & Index. Cambridge Univ. Press, Cambridge. S TIGLER , S. M. (1986). The History of Statistics: The Measurement of Uncertainty Before 1900. Harvard Univ. Press, Cambridge, MA. MR0852410 S TIGLER , S. M. (2010). Darwin, Galton and the statistical enlightenment. J. Roy. Statist. Soc. Ser. A 173 469–482. MR2758727 S UROWIECKI , J. (2004). The Wisdom of Crowds. Random House, New York. WALLIS , K. F. (2014). The two-piece normal, binormal, or double Gaussian distribution: Its origin and rediscoveries. Statist. Sci. 29 106–112. MR3201857 Y ULE , G. U. (1896). Remarks on Mr. Galton’s note. J. Roy. Statist. Soc. 59 396–398. Z HU , D. and G ALBRAITH , J. W. (2010). A generalized asymmetric Student-t distribution with application to financial econometrics. J. Econometrics 157 297–305. MR2661602
