Math 5110/6830 Homework 3.2
advertisement
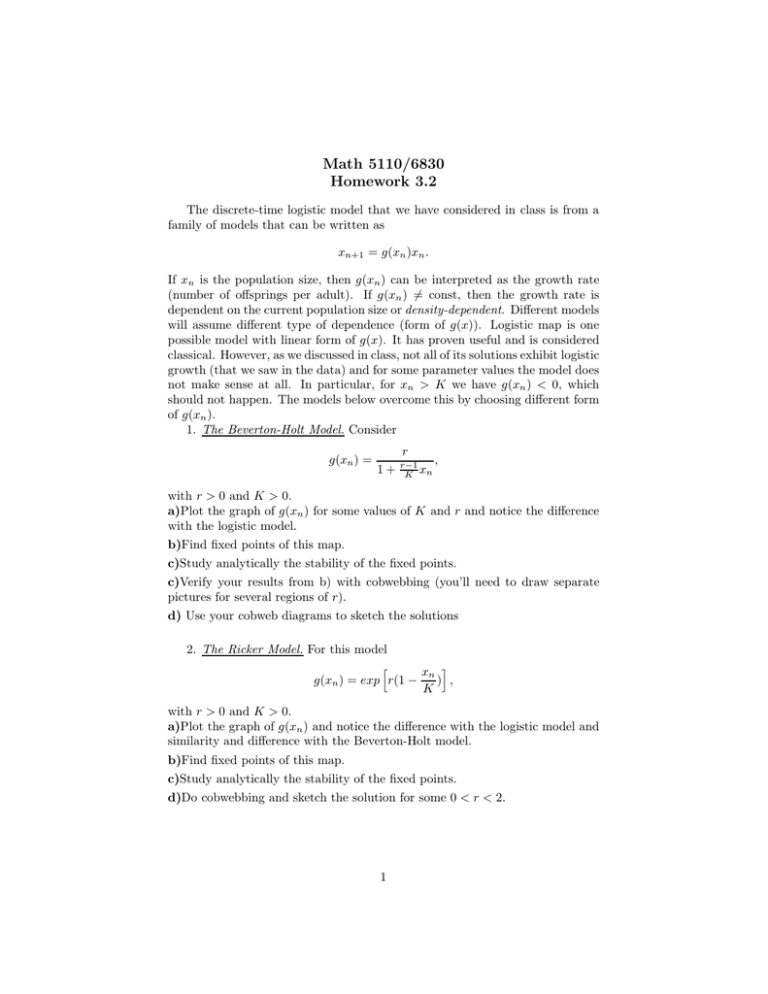
Math 5110/6830 Homework 3.2 The discrete-time logistic model that we have considered in class is from a family of models that can be written as xn+1 = g(xn )xn . If xn is the population size, then g(xn ) can be interpreted as the growth rate (number of offsprings per adult). If g(xn ) 6= const, then the growth rate is dependent on the current population size or density-dependent. Different models will assume different type of dependence (form of g(x)). Logistic map is one possible model with linear form of g(x). It has proven useful and is considered classical. However, as we discussed in class, not all of its solutions exhibit logistic growth (that we saw in the data) and for some parameter values the model does not make sense at all. In particular, for xn > K we have g(xn ) < 0, which should not happen. The models below overcome this by choosing different form of g(xn ). 1. The Beverton-Holt Model. Consider g(xn ) = r 1+ , r−1 K xn with r > 0 and K > 0. a)Plot the graph of g(xn ) for some values of K and r and notice the difference with the logistic model. b)Find fixed points of this map. c)Study analytically the stability of the fixed points. c)Verify your results from b) with cobwebbing (you’ll need to draw separate pictures for several regions of r). d) Use your cobweb diagrams to sketch the solutions 2. The Ricker Model. For this model h xn i ) , g(xn ) = exp r(1 − K with r > 0 and K > 0. a)Plot the graph of g(xn ) and notice the difference with the logistic model and similarity and difference with the Beverton-Holt model. b)Find fixed points of this map. c)Study analytically the stability of the fixed points. d)Do cobwebbing and sketch the solution for some 0 < r < 2. 1
