Math 4600, Homework 4
advertisement
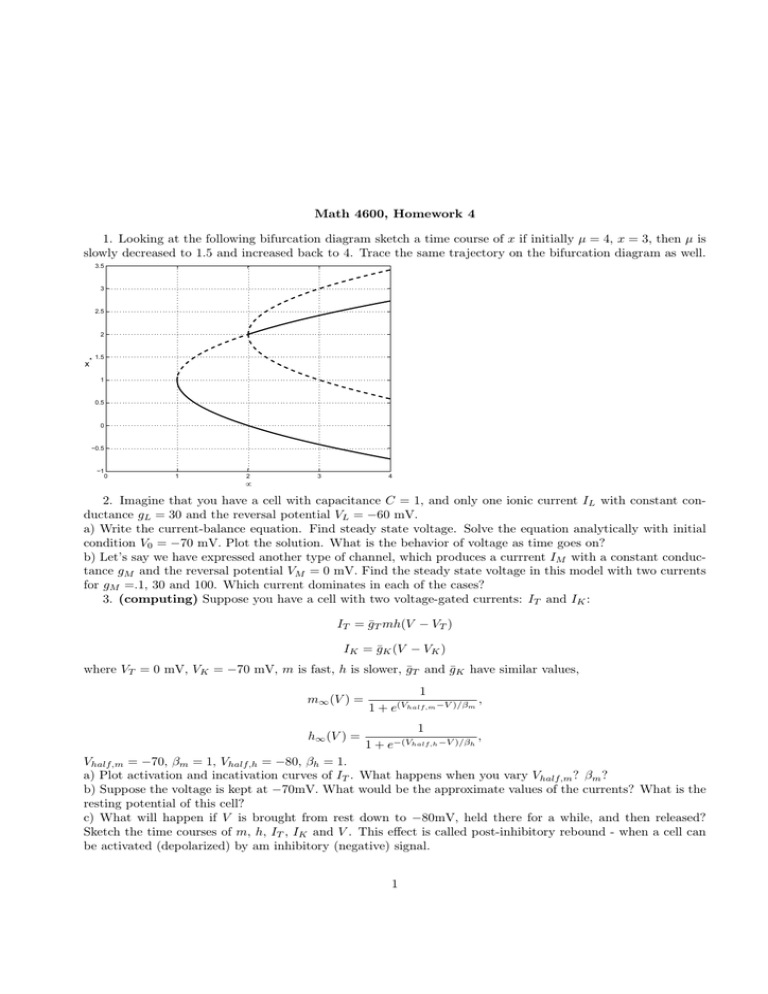
Math 4600, Homework 4 1. Looking at the following bifurcation diagram sketch a time course of x if initially µ = 4, x = 3, then µ is slowly decreased to 1.5 and increased back to 4. Trace the same trajectory on the bifurcation diagram as well. 3.5 3 2.5 2 x* 1.5 1 0.5 0 −0.5 −1 0 1 2 µ 3 4 2. Imagine that you have a cell with capacitance C = 1, and only one ionic current IL with constant conductance gL = 30 and the reversal potential VL = −60 mV. a) Write the current-balance equation. Find steady state voltage. Solve the equation analytically with initial condition V0 = −70 mV. Plot the solution. What is the behavior of voltage as time goes on? b) Let’s say we have expressed another type of channel, which produces a currrent IM with a constant conductance gM and the reversal potential VM = 0 mV. Find the steady state voltage in this model with two currents for gM =.1, 30 and 100. Which current dominates in each of the cases? 3. (computing) Suppose you have a cell with two voltage-gated currents: IT and IK : IT = ḡT mh(V − VT ) IK = ḡK (V − VK ) where VT = 0 mV, VK = −70 mV, m is fast, h is slower, ḡT and ḡK have similar values, m∞ (V ) = 1 , 1 + e(Vhalf,m −V )/βm h∞ (V ) = 1 , 1 + e−(Vhalf,h −V )/βh Vhalf,m = −70, βm = 1, Vhalf,h = −80, βh = 1. a) Plot activation and incativation curves of IT . What happens when you vary Vhalf,m ? βm ? b) Suppose the voltage is kept at −70mV. What would be the approximate values of the currents? What is the resting potential of this cell? c) What will happen if V is brought from rest down to −80mV, held there for a while, and then released? Sketch the time courses of m, h, IT , IK and V . This effect is called post-inhibitory rebound - when a cell can be activated (depolarized) by am inhibitory (negative) signal. 1
