1. Regressio n (Ch. 5):
advertisement

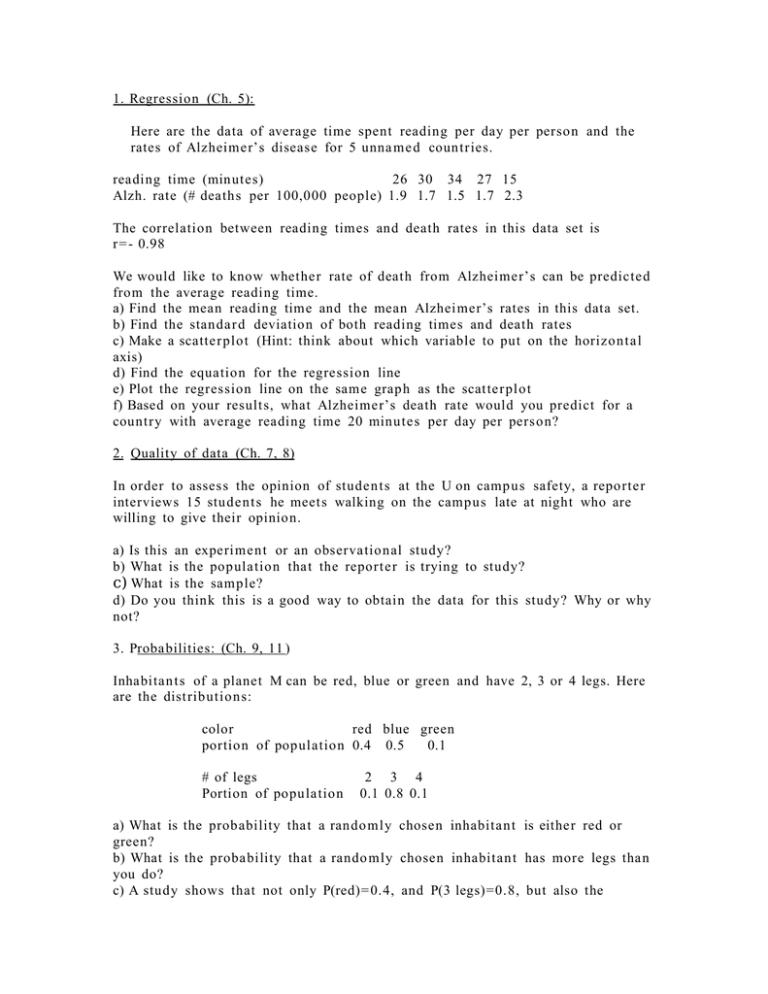
1. Regression (Ch. 5): Here are the data of average time spent reading per day per perso n and the rates of Alzheime r’s disease for 5 unna me d coun tries. reading time (minutes) 26 30 34 27 15 Alzh. rate (# deaths per 100,000 people) 1.9 1.7 1.5 1.7 2.3 The correlation between reading times and death rates in this data set is r= - 0.98 We would like to know whether rate of death from Alzheime r’s can be predicte d from the average reading time. a) Find the mean reading time and the mean Alzheimer’s rates in this data set. b) Find the standa r d deviation of both reading times and death rates c) Make a scatter plot (Hint: think about which variable to put on the horizo n t al axis) d) Find the equation for the regression line e) Plot the regression line on the same grap h as the scatte r plo t f) Based on your results, what Alzheime r’s death rate would you predict for a country with average reading time 20 minu te s per day per perso n? 2. Quality of data (Ch. 7, 8) In order to asses s the opinion of stude n t s at the U on camp u s safety, a reporte r interviews 15 stude nt s he meets walking on the camp u s late at night who are willing to give their opinion. a) Is this an experime n t or an observation al study? b) What is the population that the reporte r is trying to study? c) What is the sample? d) Do you think this is a good way to obtain the data for this study? Why or why not? 3. Probabilities: (Ch. 9, 11 ) Inhabitan t s of a planet M can be red, blue or green and have 2, 3 or 4 legs. Here are the distributions: color red blue green portion of population 0.4 0.5 0.1 # of legs Portion of popula tio n 2 3 4 0.1 0.8 0.1 a) What is the probability that a rando m ly chosen inhabita n t is either red or green? b) What is the probability that a rando mly chosen inhabitan t has more legs than you do? c) A study shows that not only P(red)= 0.4, and P(3 legs)=0.8, but also the probability that an inhabitant is red and has 3 legs is 0.3. Make a Venn diagra m to reflect these data. d) What is the probability that a rando m ly chosen inhabitan t has 3 legs, but isn’t red? e) What is the probability that a rando mly chosen inhabita n t neither has 3 legs nor is red? f) Are the events of being red and having 3 legs indepen d e n t? (Hint: use multiplication rule for indepe n d e n t events) 4. Distribution of xbar (Ch. 10) (also involves Normal comp u t a tio n s, ch. 3): Newborn babies have mean weight μ = 3200 g and the stan d ar d deviation σ = 470 g. There are 100 babies born in the hospital on a particular week, and the hospital repor t s their average weight to a newspa pe r. a) What is the distribution of the mean weight of these 100 babies? b) What is the probability that the reporte d weight is below 3100 g? c) What is the probability that the reporte d weight is between 3100 and 3250 g? d) What is the weight level such that the probability for the reporte d weight to be above that level is 0.05? 5. Basics of confide nce intervals (Ch. 13) You measur e the weights of a ran do m sample of 25 male runne r s. The sample mean is 60 kilogra m s (kg). Suppos e that the mean weights of male run ners follow a Normal distribu tion with unknown mean µ and stan da r d deviatio n σ = 5 kg. a) Find a 95% confidence interval for µ. b) Explain in words what the confidence interval from part a) means. c) Suppose that I compu te a 98% confide nce interval. Withou t actually compu ti ng this new interval yourself, say whether it would be larger or smaller than the one you foun d in part a) ? d) How many runner s would you need to weigh to find the 95% interval with a margin of error equal to 1? 6. Basics of significance testing(Ch. 14) A psychological test measures the motivation, attitu d e, and study habits of college studen t s. Scores follow approxi ma t ely a Normal distribu tio n with mean 115 and standa r d deviation 25. You suspec t that inco ming fresh m e n have a mean which is different from 115, because they are often excited yet anxious about entering college. You give the test to 25 fresh m a n stud en t s and find their mean score is 116.2. Is this data significan t at α = 0.05 level?


