Brazilian Ethanol Business Dr. José Márcio Carvalho Department of Management University of Brasilia
advertisement
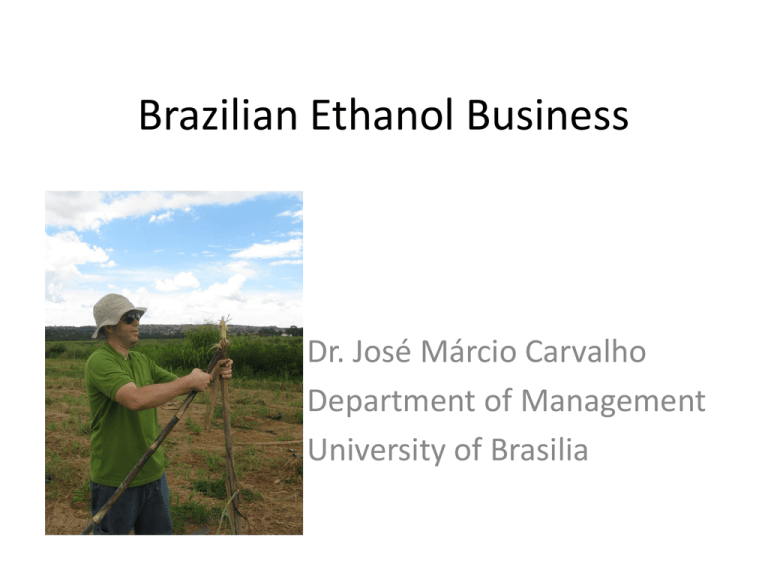
Brazilian Ethanol Business Dr. José Márcio Carvalho Department of Management University of Brasilia Entry and Expansion Strategies of MNEs • Phase 1: Exports and foreign sourcing; • Phase 2: Investment in marketing and distribution; • Phase 3: Foreign production of intermediate goods and services; • Phase 4: Deepening and widening of the value-added network; • Phase 5: The integrated network multinational. The Multinational Enterprises and the Global Economy by John Dunning and Sarianna Lundan (2008). Sugar Cane in Brazilian History • The sugar industry, confined primarily to the Northeast, was the principal source of Brazilian wealth from the 16th to the 18th century; • Sugar production called for major investments in land, labour (i.e., slaves), and machinery; consequently, a relatively small number of wealthy, plantation-owning families controlled the industry. Sugarcane Plant • (Saccharum officinarum), perennial grass of the Gramineae family cultivated in tropical and subtropical regions worldwide for its sweet sap; • Sugarcane probably originated in what is now New Guinea; • Asia is now the largest producer, followed by South America and North America. Sugarcane Culture • Old agricultural practices make extensive use of labor; • Use of fire before harvesting; • Difficult work conditions; Sugarcane Culture Modern Production Systems • Intensive use of machinery; • Mechanical harvesting; • Specialized varieties of sugarcane; • Biological pests control systems. Sugarcane Production • Traditional production region, Northeast Coast; • Main production area: Sao Paulo State; • Production is developing in Minas Gerais and Parana; • Biggest potential is the Center West Region (Goias, Mato Grosso and Mato Grosso do Sul). Sugar and Ethanol Production • Juice extraction; • It is possible to produce from the sugarcane sap, both sugar and ethanol; • Sugar production sequence; • Ethanol production sequence; • This possibility brings lower risks to the business. Ethanol Production Total of Sugar Cane Processed in Brazil STATES/HARVEST 99/00 00/01 01/02 02/03 03/04 04/05 05/06 06/07 07/08 08/09 ACRE 0 0 0 RONDONIA 0 0 0 AMAZONAS 0 0 201.036 255.852 250.881 267.767 252.672 224.700 318.141 303.350 PARÁ 521.339 527.383 283.406 311.492 419.514 580.999 510.086 697.400 575.525 626.865 106.292 TOCANTINS 0 0 0 95.314 179.300 MARANHÃO 938.174 799.490 1.094.115 1.105.114 1.303.509 1.275.119 1.797.490 1.660.300 2.134.604 2.280.160 55.456 PIAUÍ 218.022 248.289 273.691 284.180 322.802 349.329 492.369 706.000 689.130 900.181 CEARÁ 131.166 65.671 73.637 88.954 63.907 79.444 40.709 27.400 8.250 122.355 R. G. NORTE 1.892.617 2.388.270 2.064.515 2.681.857 2.614.068 2.917.677 2.356.268 2.397.400 2.047.750 3.186.768 PARAIBA 3.418.496 3.594.320 4.001.051 4.335.516 5.017.263 5.474.229 4.291.473 5.107.700 5.653.047 5.885.978 PERNAMBUCO 13.320.164 14.366.994 14.351.050 14.891.497 17.003.192 16.684.867 13.858.319 15.293.700 19.844.415 18.949.518 ALAGOAS 19.315.230 25.198.251 23.124.558 22.645.220 29.536.815 26.029.770 22.532.291 23.635.100 29.444.208 27.309.285 SERGIPE 1.163.285 1.413.639 1.316.925 1.429.746 1.526.270 1.465.185 1.109.052 1.136.100 1.371.683 1.831.714 BAHIA 2.098.231 1.920.653 2.048.475 2.213.955 2.136.747 2.268.369 2.391.415 2.185.600 2.522.923 2.541.816 MINAS GERAIS 13.599.488 10.634.653 12.204.821 15.599.511 18.915.977 21.649.744 24.543.456 29.034.195 35.723.246 42.480.968 ESPIRITO SANTO 2.126.902 2.554.166 2.010.903 3.292.724 2.952.895 3.900.307 3.804.231 2.894.421 3.938.757 4.373.248 RIO DE JANEIRO 4.953.176 3.934.844 3.072.603 4.478.142 4.577.007 5.638.063 4.799.351 3.445.154 3.831.652 4.018.840 SÃO PAULO 194.234.474 148.256.436 176.574.250 192.486.643 207.810.964 230.280.444 243.767.347 263.870.142 296.242.813 346.292.969 PARANÁ 24.351.048 19.320.856 23.075.623 23.892.645 28.485.775 28.997.547 24.808.908 31.994.581 40.369.063 44.829.652 SANTA CATARINA 0 0 0 0 0 0 0 0 0 0 R. G. SUL 0 0 80.262 102.999 93.836 77.997 57.976 91.919 128.980 107.184 MATO GROSSO 10.110.766 8.669.533 10.673.433 12.384.480 14.349.933 14.447.155 12.335.471 13.179.510 14.928.015 15.283.134 MATO GROSSO DO SUL 7.410.240 6.520.923 7.743.914 8.247.056 8.892.972 9.700.048 9.037.918 11.635.096 14.869.066 18.090.388 GOIÁS 7.162.805 7.207.646 8.782.275 9.922.493 13.041.232 14.006.057 14.559.760 16.140.043 21.082.011 29.486.508 CENTER-SOUTH 263.948.899 207.099.057 244.218.084 270.406.693 299.120.591 328.697.362 337.714.418 372.285.061 431.113.603 504.962.891 NORTH-NORTHEAST 43.016.724 BRAZIL 306.965.623 257.622.017 293.050.543 320.650.076 359.315.559 386.090.117 387.441.876 425.535.761 495.723.279 569.062.629 Source: Brazilian Ministry of Agriculture/ 2010 50.522.960 48.832.459 50.243.383 60.194.968 57.392.755 49.727.458 53.250.700 64.609.676 64.099.738 Pro-Alcool • Government program implemented to create a renewable source of energy in Brazil; • Started during the first oil crisis; • Aim the development of technologies for sugarcane production, sugarcane processing, and new vehicles engines; • Very successful program. The Flex Engine • A engine capable of using both gasoline and ethanol at the same time in any proportion; • Widely produced and used in Brazil as car engines; • Research to develop flex engines for trucks and small airplanes; • Possibility to chose between ethanol and gasoline; The Flex Engine • 40 % of all Brazilian cars do use the flex engine (more than 3.000.000 cars); • Currently more than 92% of the new cars sold in Brazil have a flex engine; Brazilian Ethanol Exports VOLUME (millons of liters) YEAR Brasil 2000 2001 2002 2003 2004 2005 2006 2007 2008 Source: Secex 2010 227,3 345,7 789,2 757,4 2.408,3 2.600,6 3.416,6 3.530,1 5.118,7 Center-South 183,6 300,0 576,1 457,3 1.865,8 2.090,8 2.966,3 3.055,4 4.590,3 North-NE 43,7 45,7 213,0 300,1 542,5 509,8 450,3 474,7 528,4 Brazilian Ethanol Exports US$ FOB (millons US$) Year Brasil 2000 2001 2002 2003 2004 2005 2006 2007 2008 Source: Secex, 2010. 34,8 92,1 169,2 158,0 497,7 765,5 1.604,7 1.477,6 2.390,1 Center-South 24,2 78,9 121,9 91,1 376,5 602,0 1.415,1 1.266,9 2.149,5 North-NE 10,6 13,2 47,3 66,9 121,2 163,5 189,6 210,7 240,6 Brazilian Ethanol Exports Country Total United States The Netherlands Jamaica El Salvador Japão Trinidad and Tobago Virgen Islands South Korea Costa Rica Nigéria United Kingdom Índia Source: Unica, 2010. VOLUME (millons of liters) 2006 2007 3.416,6 3.530,1 1.749,2 849,7 344,5 800,9 133,0 312,1 182,7 226,8 227,7 367,2 72,3 93,4 92,2 43,1 26,7 9,9 160,5 52,7 67,4 172,2 124,2 47,1 2008 4.848,1 1.519,4 1.331,4 436,1 355,9 263,2 224,3 187,9 186,6 109,4 97,8 69,6 66,4 The USA Market • Strategic decision to increase the use o renewable sources of energy; • The market that is currently consuming 42 billion liters of ethanol is projected to absorb 136 billion liters before 2022; • The Environment Protection Agency (EPA) classified the Brazilian ethanol as “advanced” source of energy (it is responsible for a low emission of CO2). The Business Environment • More than 150 companies are producing ethanol in Brazil; • A consolidation process just started; • It is increasing the investment of international capital (currently it is 25%); • New categories of companies are investing in the sector (oil companies and traders). International Capital • Cosan (Brazilian) and Shell (British and Dutch); • Bunge (Dutch) and Moema (Brazilian); • Shree Renuka Sugars (Indian) and Equipav (Brazilian); • Louis Dreyfus (French) and Santelisa Vale (Brazilian); • ADM • ETH and Brenco; • Petrobras; • BP; Entry and Expansion Strategies of MNEs • Phase 1: Exports and foreign sourcing; • Phase 2: Investment in marketing and distribution; • Phase 3: Foreign production of intermediate goods and services; • Phase 4: Deepening and widening of the value-added network; • Phase 5: The integrated network multinational. The Multinational Enterprises and the Global Economy by John Dunning and Sarianna Lundan (2008).

